
Figure 4.
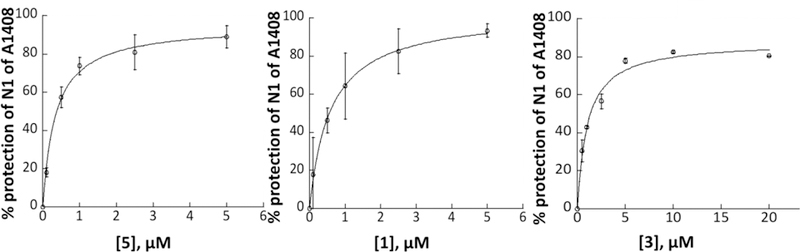
Quantification for DMS footprinting of 5, 1, and 3 binding to the helix 44 region of E. coli 70S ribosomes. Average calculated % protection of N1 of A1408 from three trials for 5 and two trials for 1 and 3 was plotted as a function of aminoglycoside concentration and fitted to a simple binding equation to obtain apparent Kd values of 0.34 ± 0.05 μM (R2=0.99), 0.59 ± 0.05 μM (R2=0.99), and 1.03 ± 0.20 μM (R2=0.99) for 5, 1, and 3, respectively.