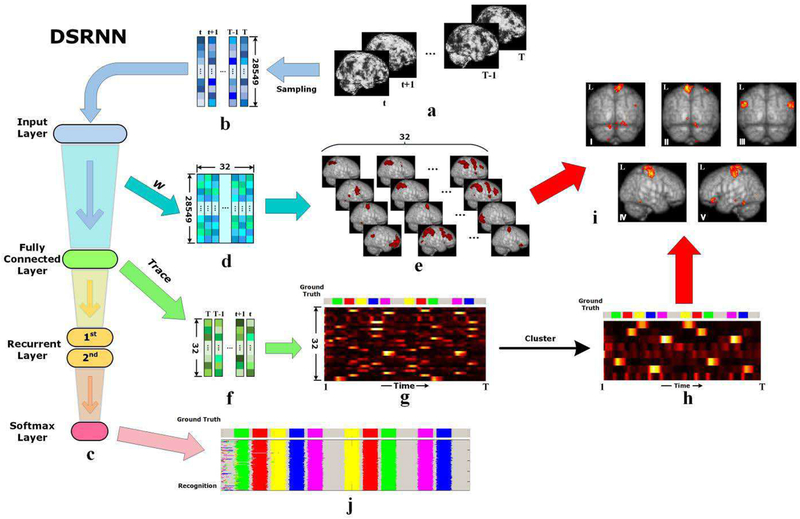
Fig. 3.
Illustration of DSRNN modeling process. (a) Raw brain tfMRI images series. (b) Vectorization of tfMRI image series after sampling. (c) Hierarchy diagram of DSRNN model. (d) Weight matrix between input layer and fully connected layer. (e) Visualization of activated brain region groups represented by weight matrix of fully connected layer. (f) Output time series of fully connected layer. Each column vector indicates the activation of 32 distinctive brain region groups. (g) Visualization of fully time-scale output time series of fully connected layer, also the activation traces of 32 brain region groups. Motor task is used as an example, and the ground-truth temporal distribution of event blocks is illustrated at the top. (h) Visualization of clustered activation traces.(i) Visualization of brain activation maps corresponding to 5 motions, based on 32 brain region groups (e) and their clustered activation traces (h). Brain activation maps from I to VI are corresponding to the motion events of right foot, left foot, tongue, left hand and right hand, respectively. (j) Recognition of brain states.

