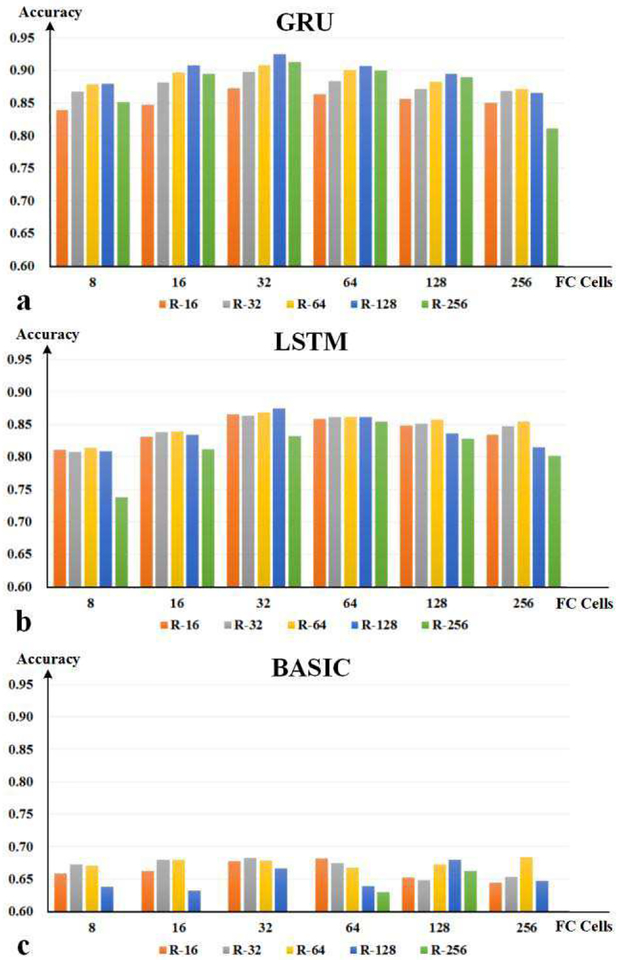
Fig. 8.
The exploration results of hyper parameters. (a) Results of GRUbased network. (b) Results of LSTM-based network. (c) Results of basic unitbased network. The horizontal axis represents the number of neurons in fully connected layer, and the vertical axis indicates the recognition accuracy. All networks contain two recurrent layers, and bars in different colors indicate different numbers of cell units per recurrent layer.

