
Fig. 3.
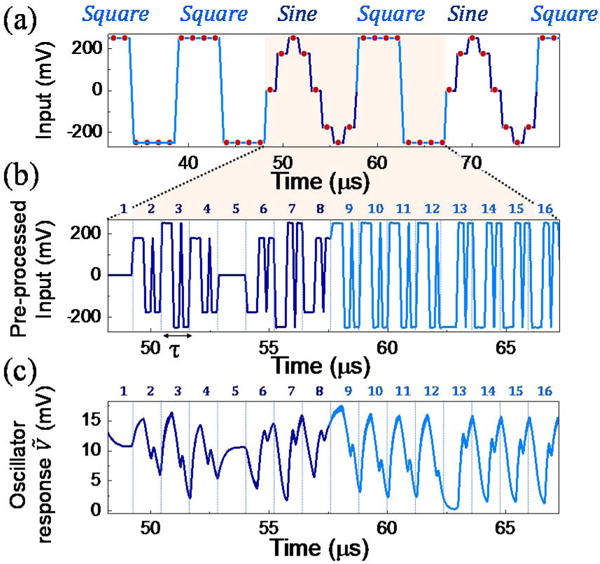
(a) Input waveform. The task is to discriminate sines from squares at each red point. There are 8 discrete red points in each sine and square waveform. (b) Zoom-in on the preprocessed input waveform for a sine and a square. The corresponding fast binary input sequences are numbered from 1 to 16 (8 for the sine, 8 for the square. (c) Envelope of the experimental oscillator emitted voltage amplitude (μ0H = 466 mT, IDC = 7 mA). The trajectories created in response to the input waveform are numbered from 1 to 16 (8 for the sine, 8 for the square).