
Fig. 9.
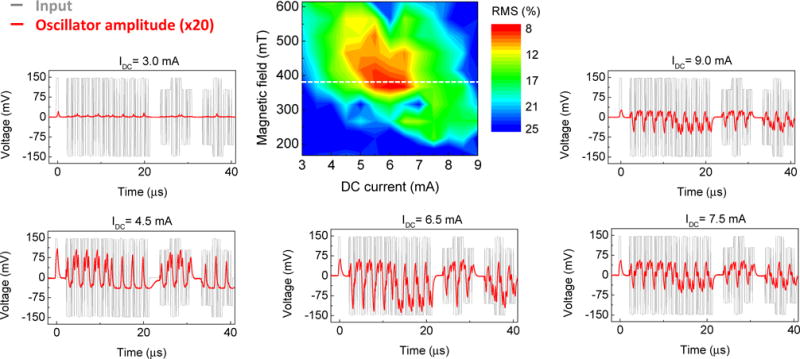
Root mean square of output-to-target deviations: map as a function of dc current IDC and magnetic field μ0H. The oscillator voltage amplitude curves (in red) in response to the input waveform (in gray) are plotted for selected dc currents (3, 4.5, 6.5, 7.5 and 9) mA and magnetic field μ0H = 380 mT. Here Vin= 300 mV and θ = 100 ns is used. RMS map corresponds to the target shifted by τ/2 with respect to the input.