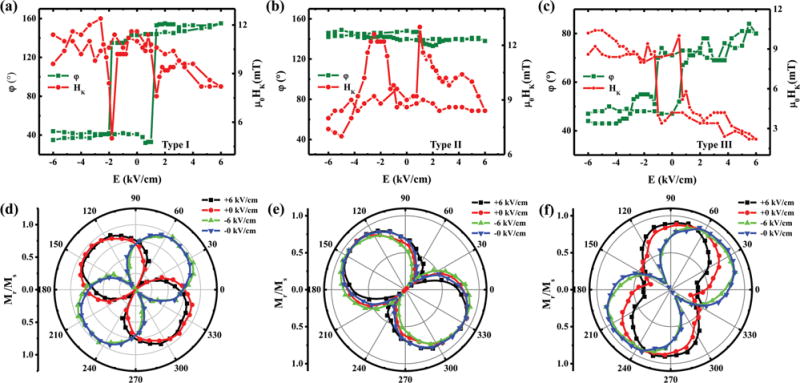
Figure 2.

The ROT-MOKE results for a) type I, b) type II, and c) type III, respectively. The olive and red curves indicate the variations of the angle of MEA, ϕ and HK with the change of in situ electric field, respectively. The single standard deviation uncertainties, based on repeated measurements, for ϕ and μ0HK measurements were less than 5° and 0.6 mT, respectively. (Error bars not shown for clarity.) The corresponding Mr/Ms curves with different in situ electric fields (+6, +0, −6, −0 kV cm−1) obtained from L-MOKE for d) type I, e) type II, and f) type III, respectively. The angle θ is defined as the angle between the applied magnetic field and the [100] direction of PMN-PT.
