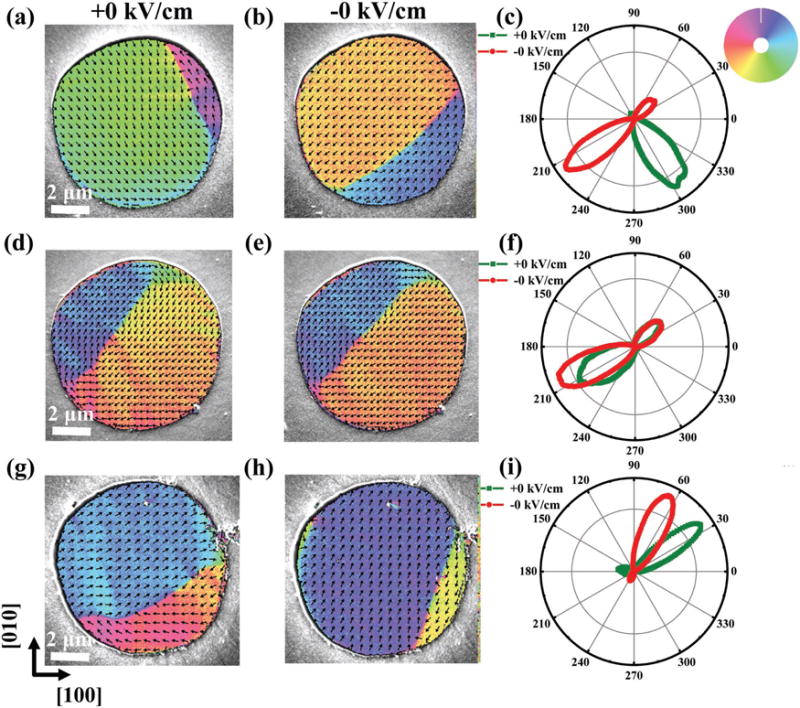
Figure 3.

SEMPA images of type I (top), type II (middle), and type III (bottom), respectively. a,d,g) The SEMPA images for the remanent states of the positively polarized cases. b,e,h) The SEMPA images for the remanent states of the negatively polarized cases. The magnetization directions in SEMPA images are given by the color wheel. c,f,i) Polar plots showing the distribution of magnetization directions presented in SEMPA images with the olive/red curves indicating the remanent states of the positively/negatively polarized cases.
