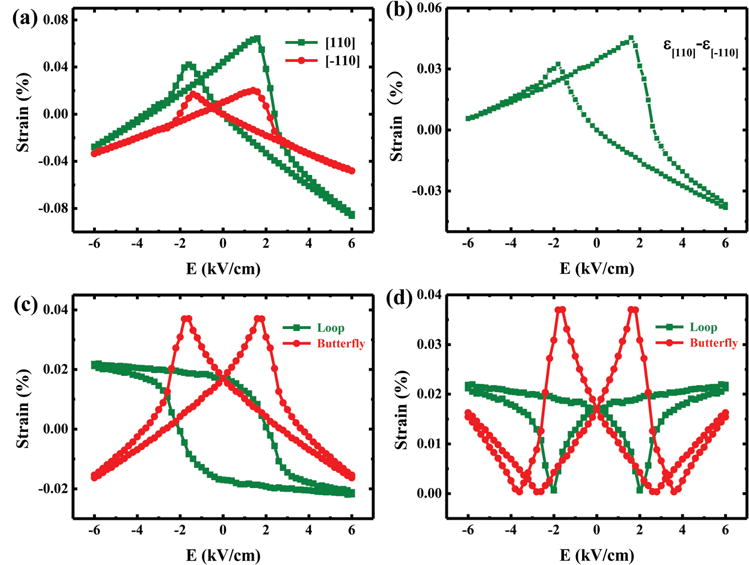
Figure 4.

a) S–E curves along the [110] (olive) and [−110] (red) directions, respectively. The single standard deviation uncertainty, based on repeated measurements, of the strain measurements is 0.003% (smaller than the plotted point size). b) The net strain obtained by subtracting the strain along the [−110] direction from that along the [110] direction. c) The antisymmetric loop-like strain (olive) and symmetric butterfly-like strain (red) decomposed from (b). d) The absolute value of strain deduced from (c).
