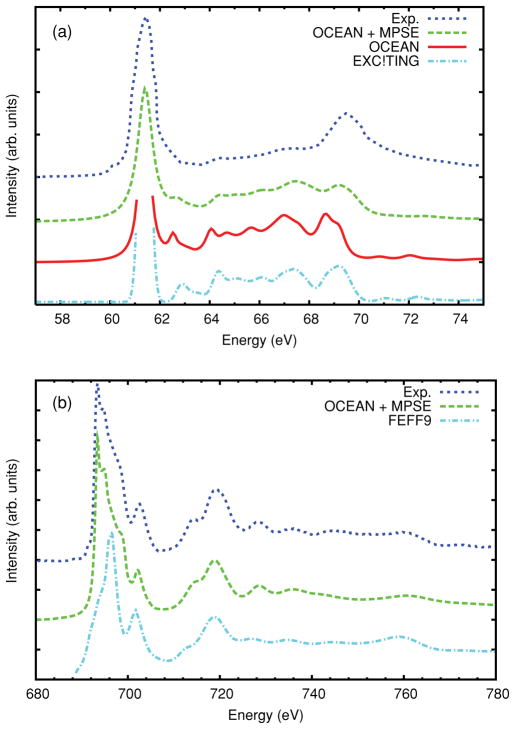
FIG. 2.
(a) The x-ray absorption near-edge structure (XANES) spectra for the Li K edge of LiF (top) and (b) the F K edge (bottom). The BSE spectra (solid, red line) are compared to the same spectra convoluted with the MPSE correction (green, dashed line) and experiment34,35 (Li data from Olovsson et al.36) (blue, dotted line). In (a) the result of another BSE code,36 (light blue, dashed-dotted line) and in (b) a calculation with the FEFF9 code (light blue, dashed-dotted line) are shown for comparison.

