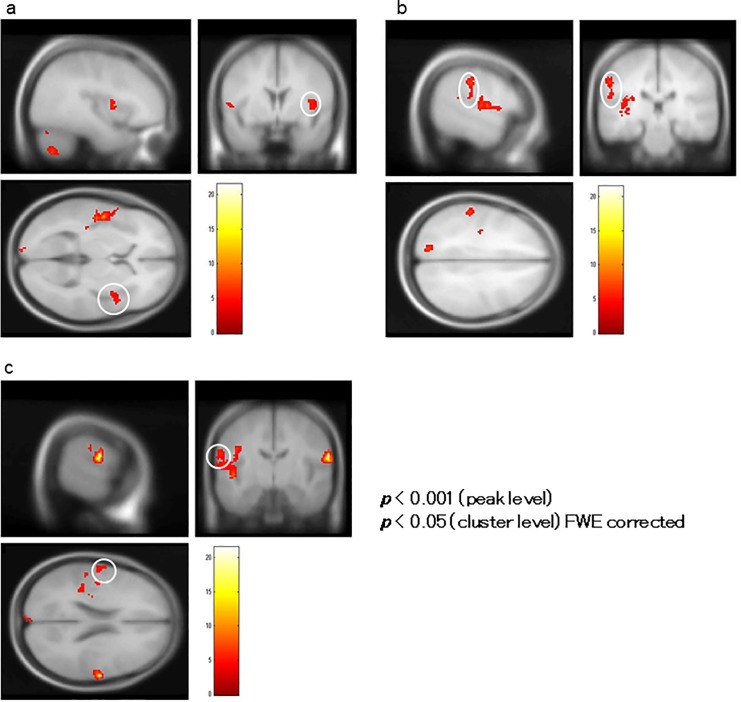
Fig 10. Correlation analysis of BOLD signal changes in the left Heschl’s Gyrus (HSC).
In a correlation analysis using blood oxygenation level-dependent (BOLD) signal change (%) in the HSC as a covariate in ROI analysis, BOLD activity in the left insula encompassing the superior temporal gyrus (not shown), right insula (indicated by the white circle in (a)), right postcentral gyrus (indicated by the white circle in (b)), and left inferior parietal lobule (indicated by the white circle in (c)) significantly correlated with BOLD signal changes in the left HSC.

