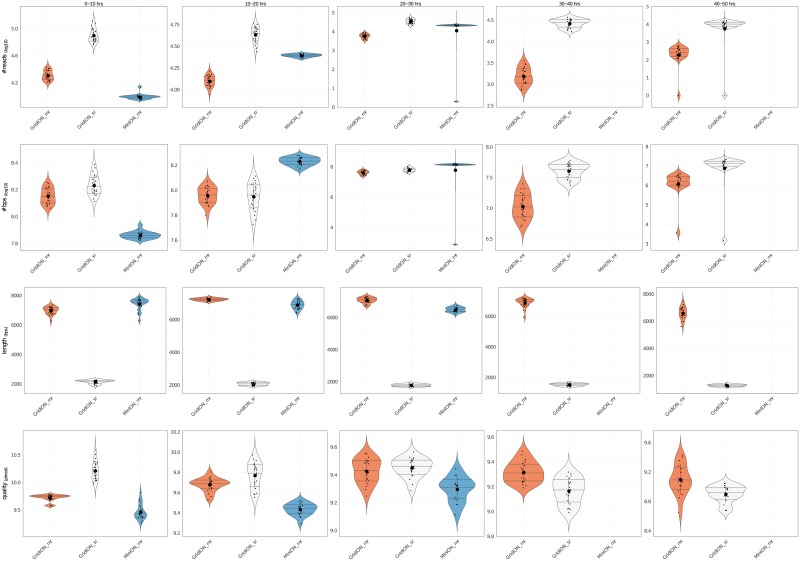
Fig 5. Violin plots for comparison between experiments.
From top to bottom, the plots show the comparison 3 ONT experiments (first 2 are GridION X5 experiments, producing multi-read and single-read .fast5 files respectively and last is a MinION experiment producing multi-read .fast5 files) in terms of reads number, base pairs number, reads mean length and reads mean quality. Comparison is done every 10 hours of experiment using time bins of 30 minutes.

