Figure 10.

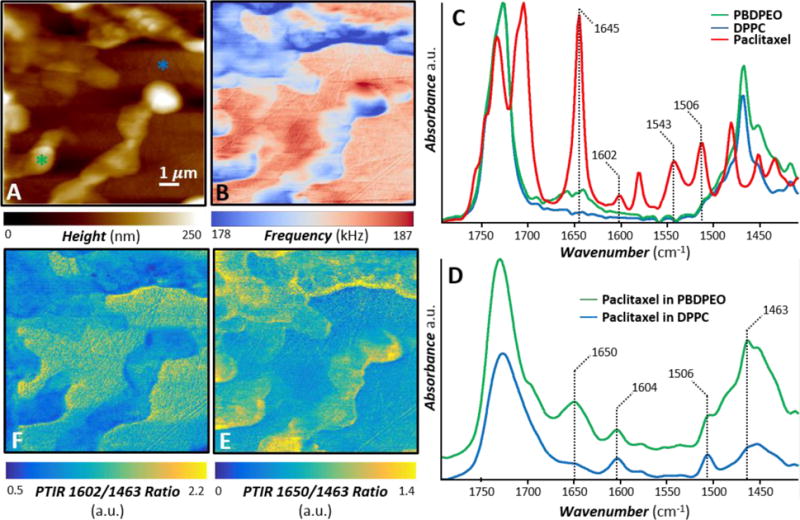
PTIR nanoscale chemical imaging. A) AFM topography image and B) AFM contact frequency image of a paclitaxel loaded (0.05 molar fraction) hybrid 1:1 molar ratio DPPC/PBDPEO film. The features with higher topography and lower contact frequency identify the polymer reach domains. C) Normalized FTIR spectra of PBDPEO (green), DPPC (blue) and paclitaxel (red). D) Characteristic PTIR spectra (displayed with a common intensity scale) obtained in the color-coded positions identified in panel A. In addition to the polymer and lipid characteristic bands (1463 cm−1, 1730 cm−1), a few distinct and characteristic paclitaxel bands indicate that the drug is partitioned in both the polymer and lipid phases. E) PTIR ratio map obtained by dividing the intensity of the 1650 cm−1 PTIR map (paclitaxel amide I band) over the 1463 cm−1 PTIR map (polymer and lipid band) reveals the heterogeneous distribution of paclitaxel in the polymer rich phase. F) PTIR ratio map obtained by dividing the intensity of the 1602 cm−1 PTIR map (paclitaxel C=C stretching band) over the 1463 cm−1 PTIR map (polymer and lipid band).
