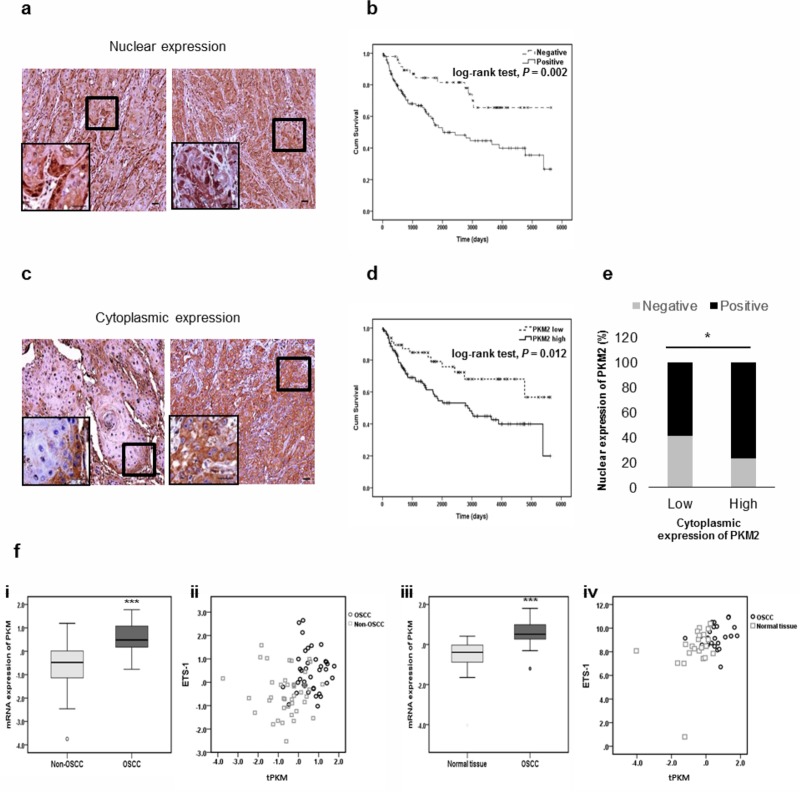
Fig 6. PKM2 level is negatively correlated with the survival rate of OSCC patients.
(a) Immunohistochemical staining with anti-PKM2 antibodies was performed on 167 OSCC TMA. The micrographs shown in this figure are representative of two nuclear positive groups (magnification ×200; scale bar, 20 μm). Nuclear expression patterns were observed at the invasive front (left) or scattered in invasive cell nests (right). Higher magnification (×1000) view was presented in the inset micrograph. (b) Overall survival of 167 patients with OSCC classified into negative- or positive- nuclear expression. Patients with positive expression of nuclear PKM2 had poorer survival rates than patients with negative expression. The results were analyzed by the log-rank test (P = 0.002). (c) The micrographs shown in this figure are representative of cytoplasmic-low (left) and cytoplasmic-high (right) groups (magnification ×200; scale bar, 20 μm). Higher magnification (×1000) view was presented in the inset micrograph. (d) Overall survival of 167 patients with OSCC classified into low- or high- cytoplasmic expression. Patients with high expression had poorer survival rates than patients with low expression. The results were analyzed by the log-rank test (P = 0.012). (e) Significant association was found between cytoplasmic and nuclear PKM2 expression by chi-square test (P = 0.024). (f) (i) Expression level of tPKM was significantly increased (***P < 0.001) in OSCC tumors (n = 40) compared with the adjacent non-OSCC tissues (n = 40). (ii) Correlation between tPKM expression and ETS-1 expression in OSCC (n = 40) and non-OSCC tissues (n = 40). Weak correlation was found (Pearson correlation = 0.250, P = 0.025). (iii) Expression level of tPKM was significantly increased (***P < 0.001) in OSCC tissues (n = 24) compared with the adjacent normal oral tissues (n = 24). (iv) Correlation between tPKM expression and ETS-1 expression in OSCC (n = 23) and normal oral tissues (n = 23). Moderate correlation was found (Pearson correlation = 0.407, P = 0.005). In scatter plots, black dots denote tumor samples, while grey dots denote control samples.

