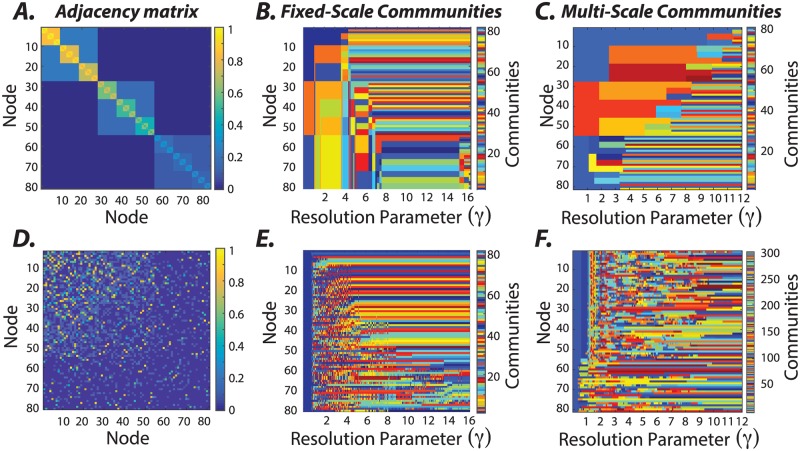
Fig 2. Uncovering hierarchical community structure in a synthetic graph.
(A) Graphs can display heterogeneity in hierarchical community structure. To gain intuition regarding the utility of our method for characterizing these sorts of graphs, we design a synthetic graph such that each node is part of a small cluster composed of 3 nodes, a medium sized cluster composed of 9 nodes, and a large cluster composed of 27 nodes. Topological heterogeneity is introduced by adding gradients in the values of edge weights such that not all clusters of a given size have the same average weight. (B) We seek to uncover the hierarchical structure in this synthetic graph. First, we use the more traditional approach of maximizing a single-layer modularity quality function [53] with the Newman-Girvan null model [57] using a Louvain-like locally greedy algorithm [54]. We sweep the resolution parameter between 1 and 16, and identify communities independently at each γ value. The limitation of this approach is that there is no guarantee that communities at one resolution correspond to communities at another resolution. (C) To overcome this limitation, we next seek to uncover the hierarchical structure in this synthetic graph using a multi-scale approach built on multi-scale community detection [31]. We find that the hierarchical community detection uncovers the true underlying community organization as we vary the value of the structural resolution parameter (γ ∈ [0, 12], τ = 0.05, an inter-layer γ increment of 0.05, and 241 layers). Moreover, the γ value at which a community is detected tracks the mean edge weight of the community; stronger communities are identified at larger γ values, and weaker communities are identified at smaller γ values. (D) For comparison, we created a null graph without any clear hierarchical community structure by randomly shuffling the edges of the graph in panel (A), while preserving the weight, degree, and strength distributions (see [63] for details). Panels (E) and (F) show the communities detected in this null graph when using the parameter sweep method and the multi-scale community detection method, respectively. Note that the lack of hierarchy in the null graph is similarly echoed in the multi-scale community structure displayed in panel (F), marked by predominantly small and unstable communities across topological scales.

