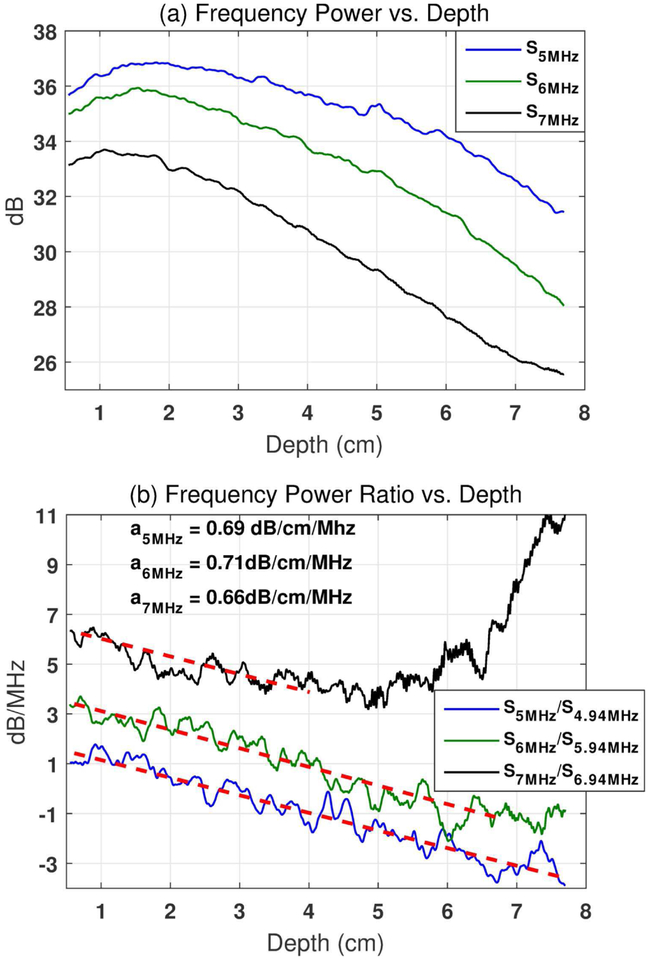
Fig. 1.
(a). Frequency power after natural logarithm conversion (i.e., ln[S(fi, zk)]) as a function of depth at three example frequencies (i.e., fi = 5, 6, and 7 MHz). (b). Frequency power ratio after natural logarithm conversion(i.e., ln[RS(fi, zk)], Δf = fi − fi−1 = 0.06MHz) as a function of depth calculated with the same frequency components and their adjacent frequencies. The frequency power ratio decay curves for 6 and 7 MHz were shifted upwards by 2 and 4 dB/MHz, respectively, for better visualization. The linear fittings for each frequency are shown by the red dashed lines with the attenuation coefficient values shown in the left upper corner of (b). The data were acquired from a Fibroscan-calibrated tissue-mimicking phantom (0.68 dB/cm/MHz). The phantom was imaged with unfocused plane wave imaging at 5 MHz center frequency using a Verasonics Vantage system.

