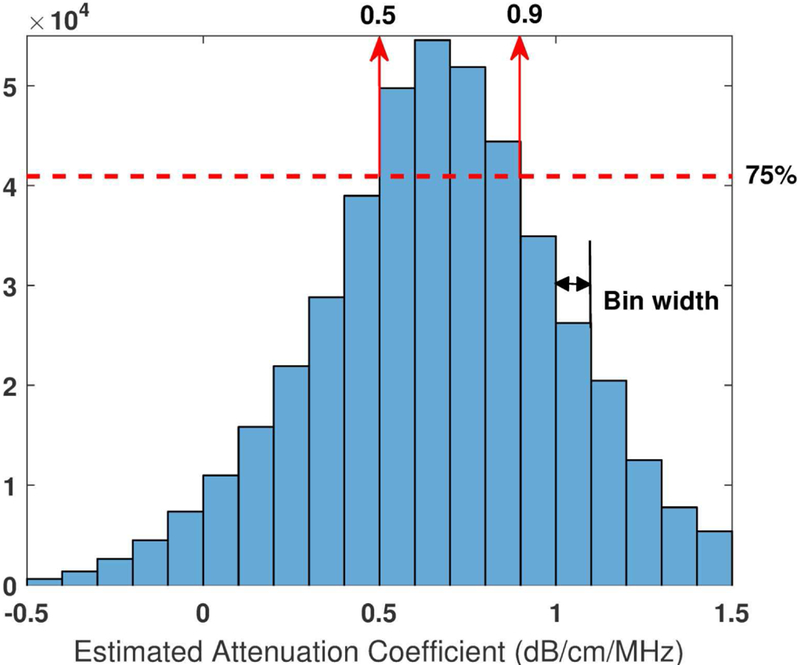
Fig. 2.
Histogram of all estimated attenuation without any constraints (ai,k,r). The data were acquired from a Fibroscan-calibrated tissue-mimicking phantom with calibrated value of 0.68 dB/cm/MHz. The phantom was imaged with unfocused plane wave imaging at 5 MHz center frequency using a Vantage system. fi range: 4–6 MHz, Δf = fi- fi−1=0.06MHz, a total number of 34 fi was used; zk range: 3 cm, zk = zk-zk−1=0.0055cm, a total number of 550 zk was used; zr range: 3 cm, Δzr = zr-zr−1=0.1cm, a total number of 30 zr was used; A total number of 34 × 550 × 30 = 5.6 × 10⁵ attenuation values were estimated.

