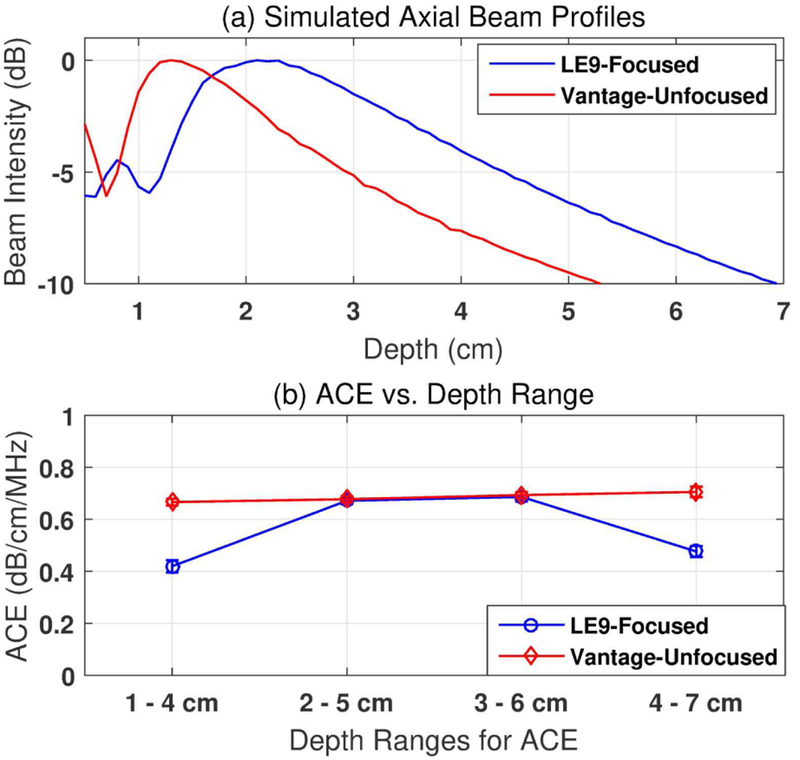
Fig. 5.
(a) Field II-Simulated axial beam profiles following the LE9 and Vantage imaging configurations. (b) Focusing effect on different ranges of depths used for attenuation estimation. The data were acquired from a Fibroscan-calibrated tissue-mimicking phantom with calibrated value of 0.68 dB/cm/MHz. The error bars show the standard deviation from 5 repeated measurements.

