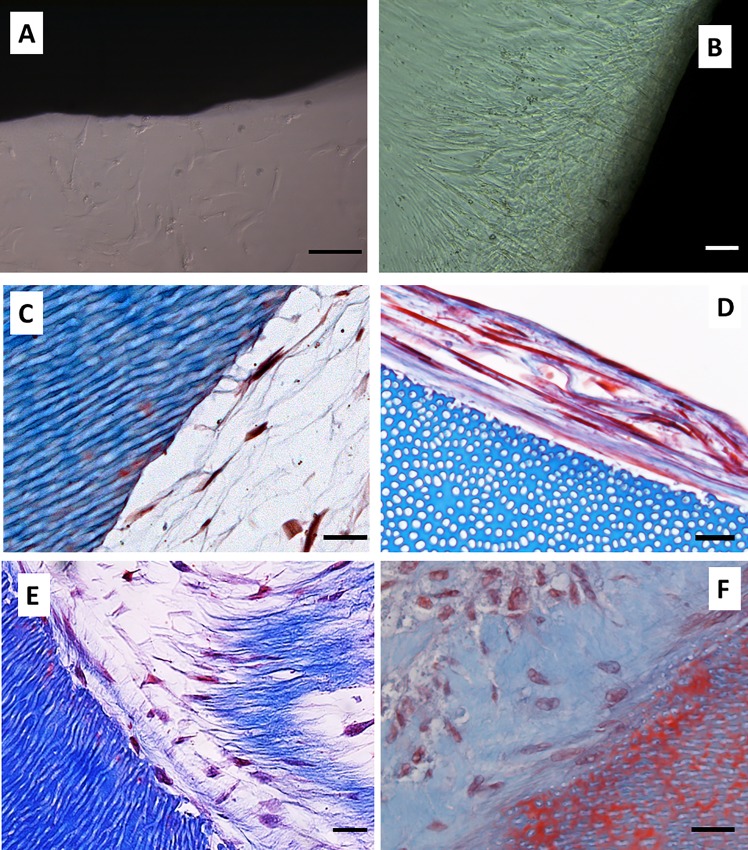
Fig 2. Cell culture kinetics on acellular dentin scaffolds.
hDPSCs were cultured on the scaffolds for up to 6 weeks and processed for light microscopy. Confluence was estimated by phase contrast microscopy. Representative images obtained at 1 week (panel A) and 6 weeks (panel B) are shown. Samples were embedded in paraffin, cut into sections, and subjected to Masson’s trichrome staining. Representative images obtained at 2 weeks (panels C and D) and 6 weeks (panels E and F) of cells grown on SA (panels C and E) and SB (panels D and F) are shown. All experiments were performed in six replicates using hDPSCs isolated from two different donors. Scale bar equals to 20 μm.

