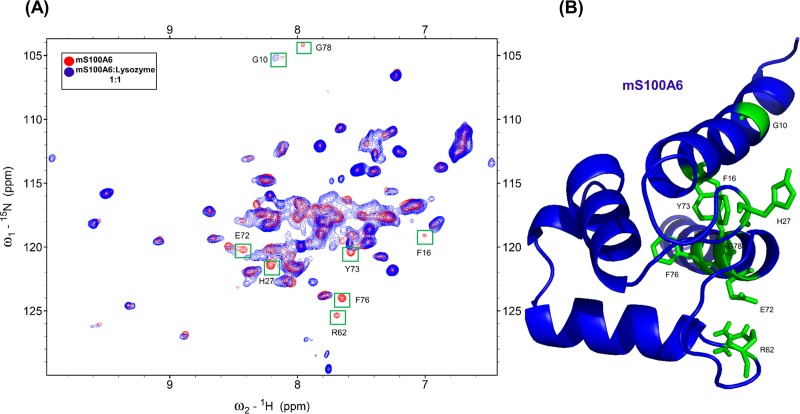
Fig 2.
(A) Overlapped HSQC spectra of 15N-labeled mS100A6 (red) and of 15N-labeled mS100A6 with unlabeled lysozyme (blue). Disappearing cross peak intensities which represent interacting amino acids (G10, F16, H27, R62, E72, Y73, F76 and G78) are boxed in green. (B) The 3D ribbon diagram of the monomer mS100A6 (blue) shows residues interacting with lysozyme in sticks form (green).

