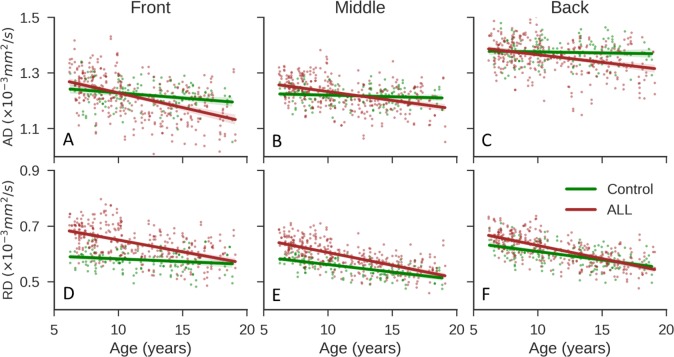
Fig 6. Comparisons of diffusion parameters for the control and ALL groups in three regions.
(A) Axial diffusivity (AD) in the front brain in the control (green) and ALL (red) groups. The dots include data for the left and right sides for subjects in each group. (B, C) The corresponding results for the middle and back brain. (D–F) The corresponding results for radial diffusivity (RD). The solid lines show the linear fits of the data. ALL, acute lymphoblastic leukemia.

