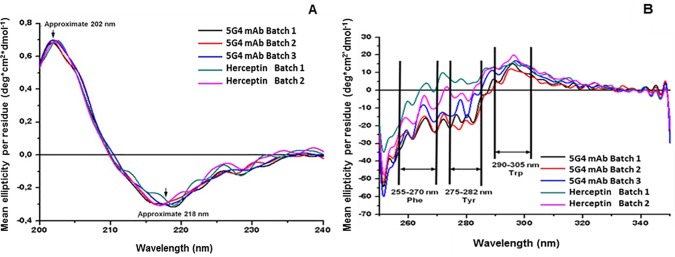
Fig 3. Far and near-UV CD spectra of 5G4 mAb and Herceptin in PBS solution, respectively.
Different batches of each mAb are shown: 5G4 mAb batch 1 (black), 5G4 mAb batch 2 (red), 5G4 mAb batch 3 (blue), Herceptin batch 1 (green) and Herceptin batch 2 (pink). The mean ellipticity readings per residue (deg.cm2.dmol-1) for each wavelength at 25°C. A: Far-UV CD spectra of 5G4 mAb and Herceptin in PBS solution. The arrows indicate the positive band at about 202 nm and the negative band at about 218 nm. B: Near-UV CD spectra of 5G4 mAb and Herceptin in PBS solution. The arrows indicate the wavelength ranges corresponding to the signals of the side chains of Phe, Tyr and Trp.

