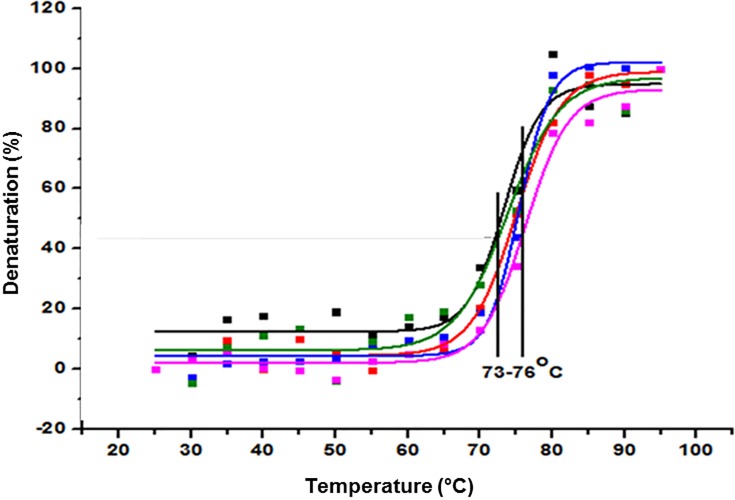
Fig 5. Thermal denaturation curves for 5G4 mAb and Herceptin in PBS solution.
Different batches of the mAbs are shown. 5G4 mAb batch 1 (black), 5G4 mAb batch 2 (red), 5G4 mAb batch 3 (blue), Herceptin batch 1 (green) and Herceptin batch 2 (pink). The indicated region shows the temperature range corresponding to the Tm values obtained.

