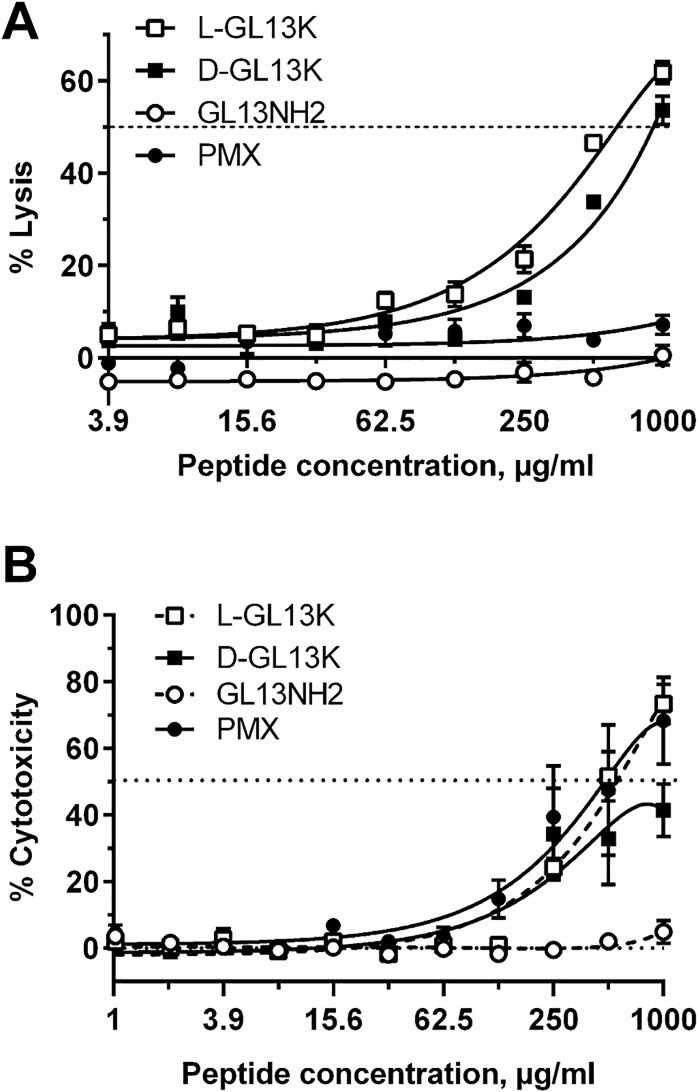
Fig 2. Peptide-induced lysis of human cells.
[A]. Human red blood cells (1%) were incubated with the listed peptides at the concentrations (μg/ml) indicated (PMX–polymyxin B). Released hemoglobin was quantitated spectrophotometrically and expressed as % lysis relative to dH2O (100% lysis). 0% lysis represents hemoglobin released by cells incubated in PBS without peptide. Data from two independent experiments were fitted to polynomial dose-response curves and are shown as mean ± SEM (N = 7). The dotted line indicates 50% lysis (LD50). [B]: HEK cells were treated for 24h with each peptide at the concentrations indicated (μg/ml). LDH release (% cytotoxicity) in peptide-treated samples was expressed relative to samples treated with 0.5% Triton X-100 (100% lysis). 0% lysis represents samples incubated in medium without added peptide. Data from two independent experiments were fitted to polynomial dose-response curves and are shown as mean ±SEM, N = 4. The dotted line indicates 50% lysis (LD50).

