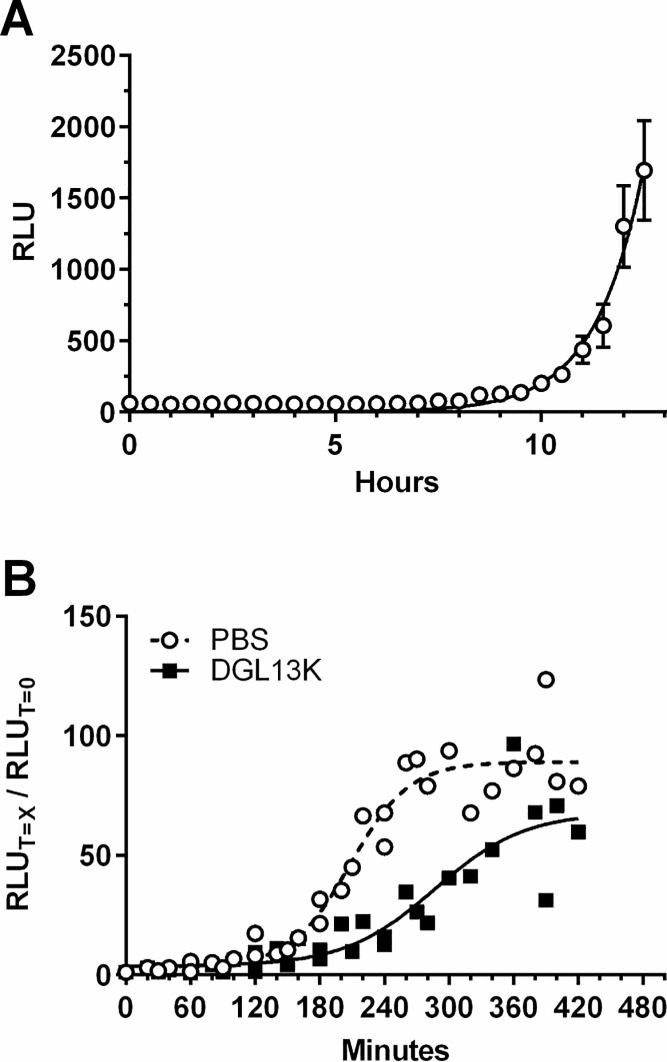
Fig 5. Infection of G. mellonella.
[A]. Bacterial infection of G. mellonella larvae monitored by luminescence (relative light units—RLU) in live larvae. Data were fitted to an exponential growth curve and are expressed as mean ± SEM, N = 24. The experiment was repeated with similar results. [B]. Effect of DGL13K (50 μg/g; closed squares) and buffer control (PBS) (open circles) on bacterial growth in live larvae. The RLU at each time point (T = X min) was expressed relative to the RLU at T = 0 min for that experimental group. Data from two independent experiments each with 12 larvae per group were fitted to sigmoidal curves (Goodness of fit: PBS R2 = 0.94; DGL13K R2 = 0.83). Each point represents the mean of 12 larvae.

