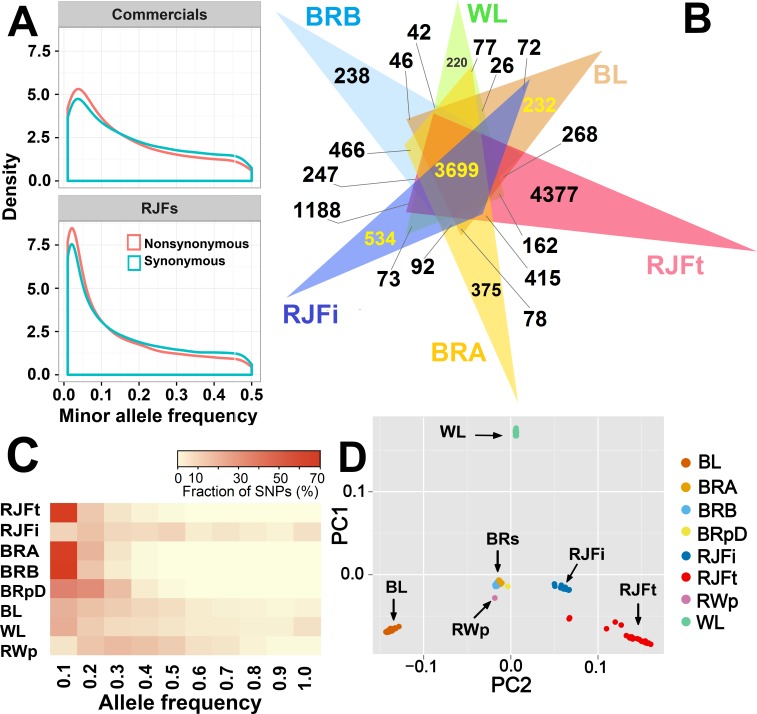
Fig 1. Analysis of SNP diversity.
(A) Comparison of the minor allele frequency spectrum of coding sequences in RJFt and commercial populations. (B) Visualization of the distribution of population-specific and group-specific variants detected from individual sequencing only. Each triangle represents the number (103) of variants exclusively segregating or detected in the corresponding population and overlapping sections denote group-specific variants. (C) Heatmap of the allele frequency distribution of population-specific variants. (D) Principal component analysis of chicken populations. Populations are coded as RJFt = red jungle fowl (Thailand), RJFi = red jungle fowl (India), BL = Brown layer, WL = White layer, RWp = Rhode-White pool, BRA = Broiler line A, BRB = Broiler line B and BRpD = Broiler line pool D, BRs = three commercial broiler lines (BRA, BRB and BRpD). show a substantially smaller proportion of rare alleles that can be attributed to the smaller effective population size caused by recent selective breeding leading to loss of rare alleles.

