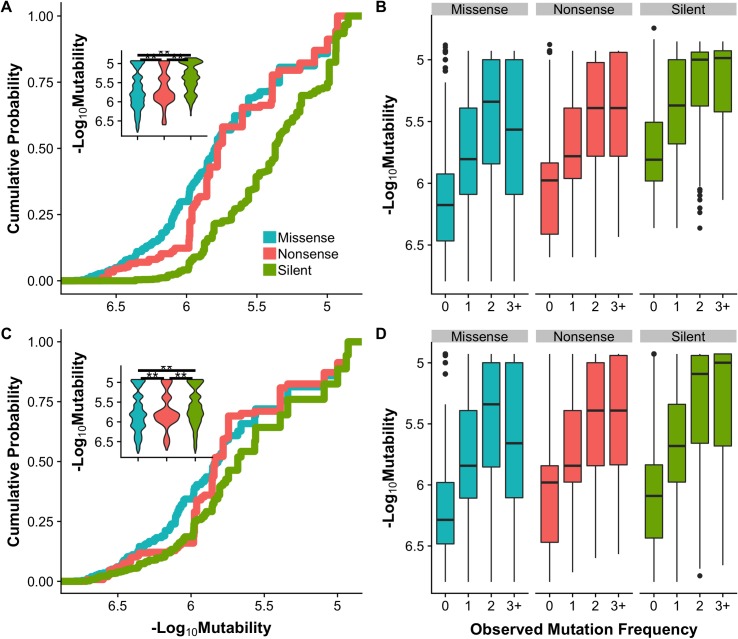
Fig 3. Mutability distributions by mutation type and mutation frequency.
(A) Cumulative distribution of codon mutability of silent (green), nonsense (red) and missense (blue) mutations. (C) Cumulative distribution of nucleotide mutability for silent, nonsense and missense mutations. Inset shows the probability density distributions of mutability by mutation type. Significance was determined by Dunn’s test; difference with p < 0.01 is marked with a double asterisk. (B) and (D) are codon and nucleotide mutability respectively binned by frequency in the COSMIC v85 pan-cancer cohort. ‘0’, ‘1’, ‘2’ and ‘3+’ refer to mutations that were not observed (including all possible point mutations), observed once, twice, or in three or more cancer samples. See S1 Table for the number of mutations in each category.

