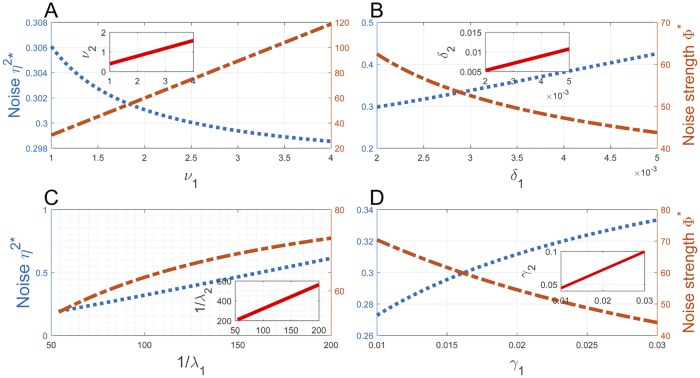
Fig 5. The noise profile in gene transcription homeostasis.
The inserts in (A)-(D) depict the linear relations (54)–(57), where ν1, δ1, λ1, and γ1 have the same unit min−1 and vary near the corresponding values specified in (51). Both η2* and Φ* change monotonically on these intervals in opposite directions, except in (C) where they both decrease in λ1. The noise η2* takes small values near 0.30 in all panels and has only insignificant variations. The noise strength Φ* takes large values but also shows insignificant variations except in Fig 5A.

