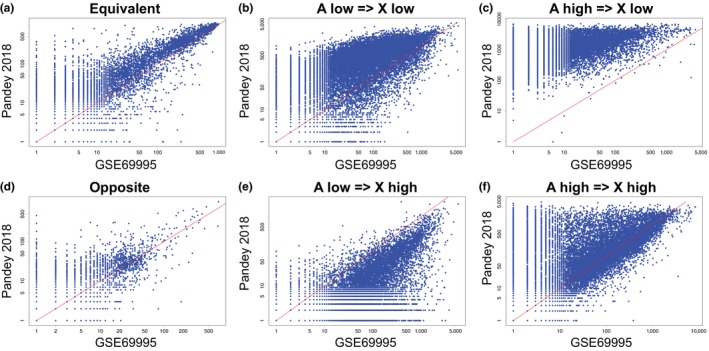
Figure 2.

Comparison of Boolean network between GSE69995 and Pandey 2018 dataset. Every point in the plot is a probeset ID in the ATH1 Affymetrix platform. The x‐ and y‐axes represent log2 count of the respective logical relationships. x = y is plotted with a red line. (a, d) Symmetric relationships. (b, c, e, f) Asymmetric relationships. (a) A equivalent X. (b) A low ⇒ X low. (c) A high ⇒ X low. (d) A opposite X. (e) A low ⇒ X high. (f) A high ⇒ X high. Our approach discovered more significant logical relationships than the previously published dataset in all other cases except A low ⇒ X high. Gene A and Gene X are candidate probeset IDs in each dataset
