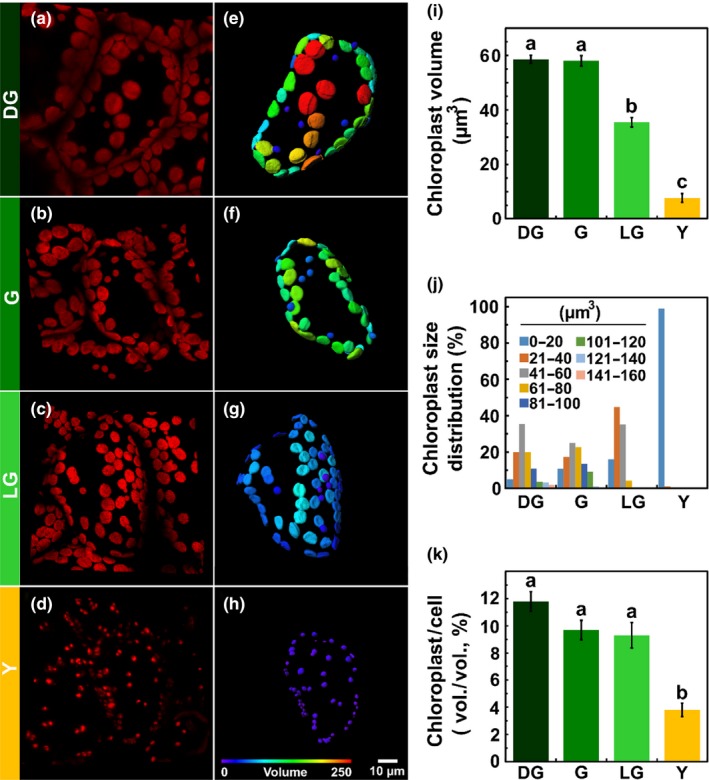
Figure 2.

Chloroplasts during leaf senescence. Characterization of chloroplasts from live tissues of Arabidopsis thaliana leaves, using confocal imaging, throughout four stages of leaf senescence: Dark Green (DG), Green (G), Light Green (LG) and Yellow (Y). (a–d) Three‐dimensional reconstructed confocal images of mesophyll cells. All images are of the same magnification. (e–h) Three‐dimensional model of the chloroplasts present in a cell shown in panels (a)–(d), respectively. Coloring is based on volume. (i) Chloroplast volume. (j) Volume distribution, calculated from the 3D models. (p < 0.05, n ≥ 128). (k) Total chloroplast volume out of the cell volume, calculated from the 3D models (p < 0.05, n ≥ 25). The data represent mean values, bars indicate standard error and letters indicate significance using Tukey‐Kramer HSD test
