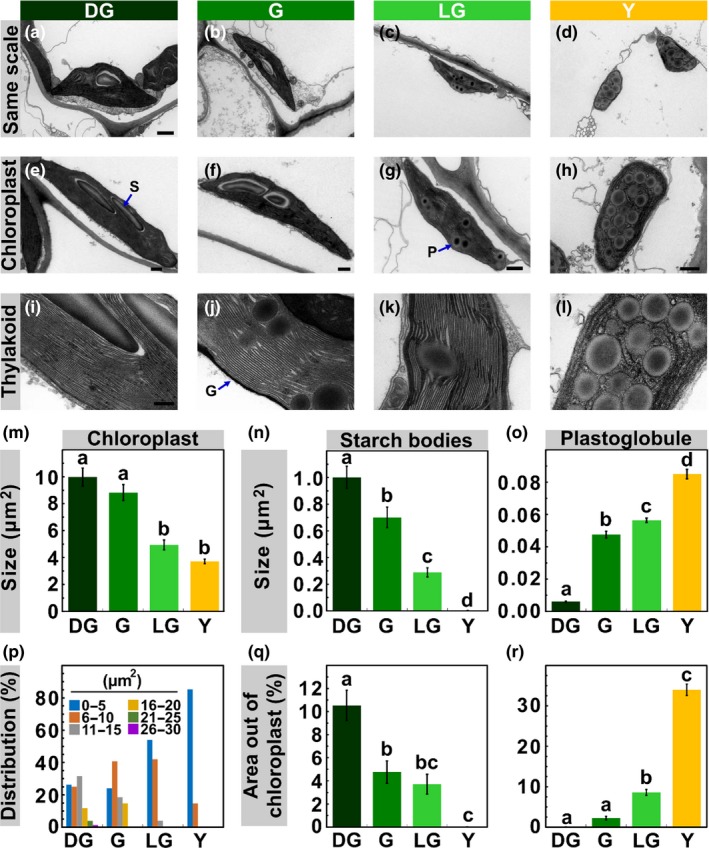
Figure 3.

Chloroplast Structure Throughout Senescence. (a‐h) Transmission electron microscopy (TEM) images of chloroplasts present in mesophyll cells of Arabidopsis thaliana during stages DG, G, LG and Y. Scale bars: a–d, 1 μm, e–h, 500 nm. (i–l) TEM images of thylakoids. Scale bar, 200 nm. Average chloroplast area (m) and size distribution (p), calculated from TEM images (p < 0.05, n ≥ 50). (n) Starch bodies average size and (q), their percentage out of the chloroplast total area, as calculated from TEM images (p < 0.05, n ≥ 40). (o) Plastoglobules average size and (r), their percentage out of the chloroplast total area (p < 0.05, n ≥ 30). The data represent mean values, bars shown indicate standard error and letters indicate significance
