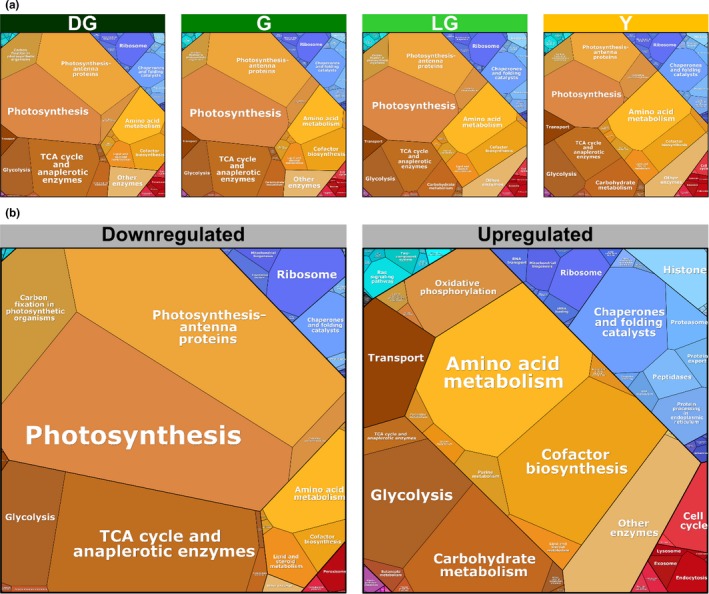
Figure 5.

Quantitative composition of proteomes during senescence. Visual representation of proteomic data of Arabidopsis thaliana mesophyll cells during four stages of leaf senescence, based on proteomic data normalized to total protein. ~3,500 proteins that passed the ANOVA significance test (p < 0.05) were used for this analysis. (a) Proteomaps of total proteins. (b) Proteomaps of downregulated and upregulated proteins
