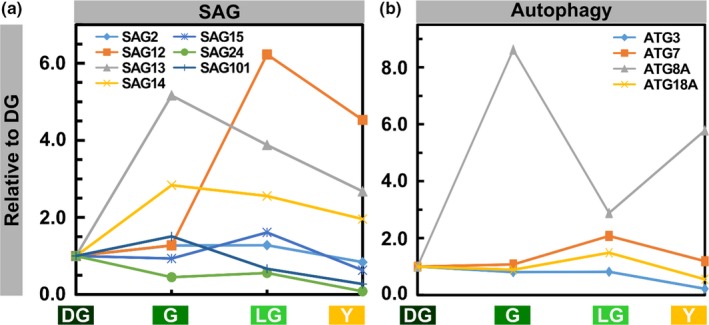
Figure 8.

Levels of SAG and Autophagy Proteins During Senescence. (a) SAG proteins. (b) Autophagy proteins. Values are based on proteomic data normalized to leaf area. Proteins were selected from those that passed the ANOVA significance test (p < 0.05). Protein levels are relative to the DG stage
