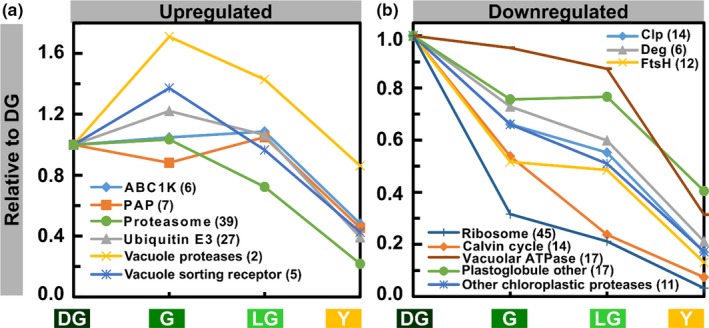
Figure 9.

Behavior of Selected Protein Groups During Senescence. (a) Upregulated protein groups. Groups were considered upregulated if their level exceeded their level in a previous stage at least once. (b) Downregulated protein groups. Values are means of levels of proteins comprising a group. Numbers in parentheses indicate the number of proteins in each group. Protein levels are relative to the DG stage
