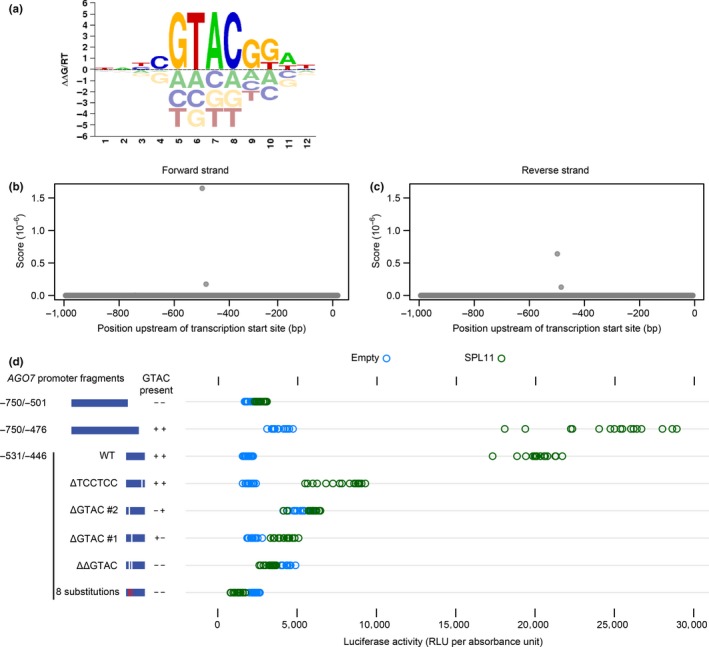
Figure 2.

Identification of SPL11 binding sites. (a) Sequence logo for SPL11 PWM, as downloaded from CisBP. Individual position weights can be interpreted as binding specificity contributions (changes in free energy, arbitrary units). (b and c) Scores for SPL11 PWM at each position of the 1‐kb region upstream of the annotated AGO7 transcription start site. (d) Reporter activity (relative luminescence units normalized by A600) for SPL11 and pDEST22 (empty vector) tested in yeast against AGO7 promoter baits including several derivatives of the ‐531/‐446 region. Modifications included one or two 4‐bp deletions, 8 substitutions (TCCG/AAGG), and an unrelated 6‐bp deletion; see Table 2, below
