
Figure 3.
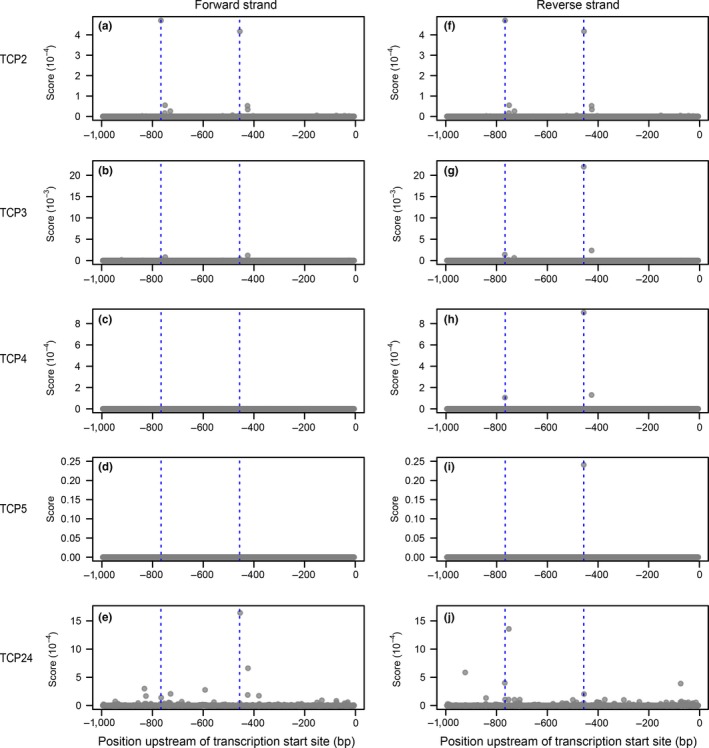
Identification of TCP binding sites. (a to j) PWM scores at each position of the 1‐kb region upstream of the annotated AGO7 transcription start site for the TCPs indicated. Dashed blue lines indicate the two highest scoring positions for TCP2: a “GGGACC“ sequence at ‐764/‐770 and a “TGGTCC“ sequence at ‐459/‐454. Panels A and F are identical, because the CisBP model for TCP2 is perfectly symmetrical