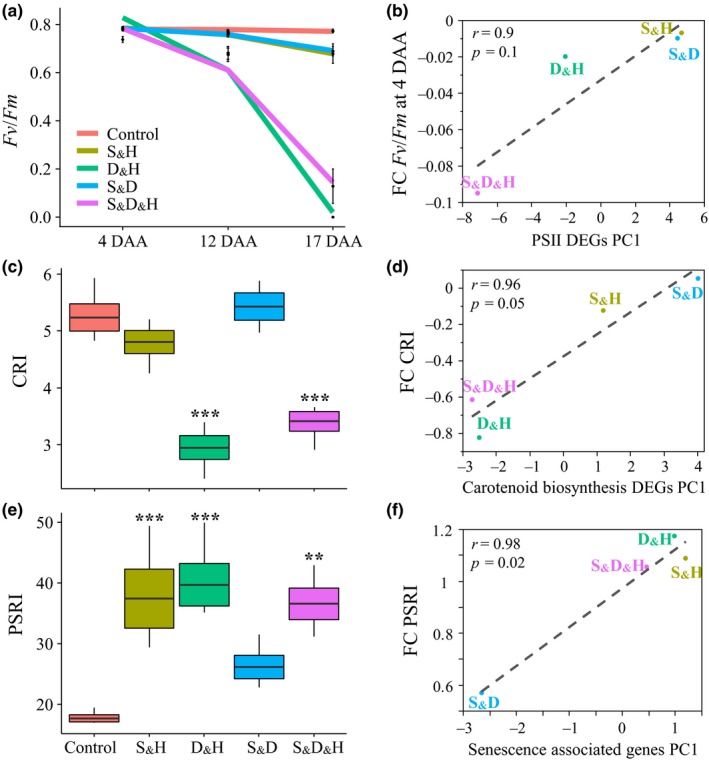
Figure 2.

Differential effects of combined stresses on photosynthetic apparatus, its associated pigments and the progression of senescence at the physiological and transcriptional levels. (a) Maximal photochemical efficiency of photosystem II (F v/F m), at 4, 12, and 17 days after anthesis (DAA), under control and combinations of stresses. (b) Correlation between first principle component (PC1) of expression pattern of genes related to photosystem II (PSII) and fold change (FC) values of F v/F m at 4 DAA. (c) Box plots of carotenoid reflectance index (CRI) that is calculated as 1/W510–1/W550. W represents the wavelengths used to calculate the reflectance index. (d) Correlation between PC1 of expression pattern of genes involved in carotenoid synthesis and FC values of carotenoid content. (e) Box plots of plant senescence reflectance index (PSRI) that is calculated as [(W680‐W500)/W750] × 1000. (f) Correlation between PC1 of expression pattern of senescence‐associated genes (SAGs) and PSRI. ** and *** indicate significant differences between control and stress treatments at p < 0.01 and 0.001, respectively, as determined by Dunnet's test. Values are mean (n = 4)±SE. Growth conditions are as follows: salinity and heat (S&H), drought and heat (D&H), salinity and drought (S&D), salinity, drought, and heat (S&D&H)
