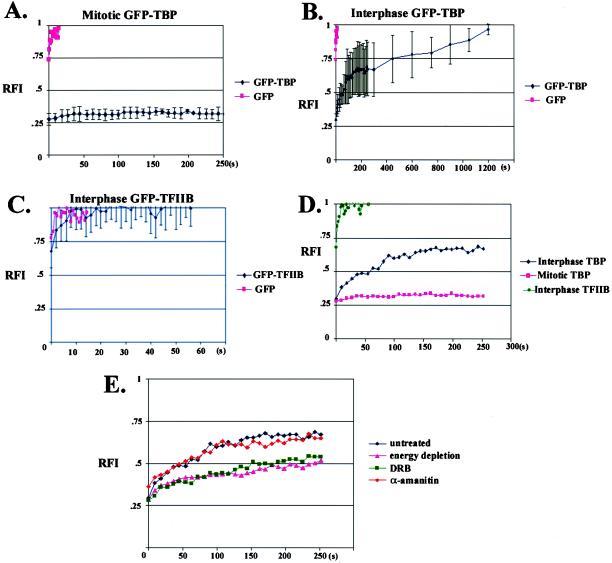
Figure 5.
Quantitative analyses of fluorescence recovery after photobleaching for GFP-TBP and GFP-TFIIB. The fluorescence recovery (y-axis, RFI, 100% recovery = 1) as a function of time (x-axis, seconds) is shown for GFP-TBP during mitosis (A) and interphase (B), and GFP-TFIIB during interphase (C). The fluorescence recovery within the 2 μm2 bleached zone was calculated (Materials and Methods) at various time points after photobleaching. Little fluorescence recovery is observed during mitosis for GFP-TBP (panel A). In interphase, the nucleoplasmic-distributed GFP-TBP shows fluorescence recovery approaching 100% within 20 min (panel B), which is 100-fold slower than that for GFP-TFIIB (panels C and D). The effects of transcriptional inhibition by α-amanitin, DRB, and energy depletion on fluorescence recovery of GFP-TBP (E) during interphase were examined.

