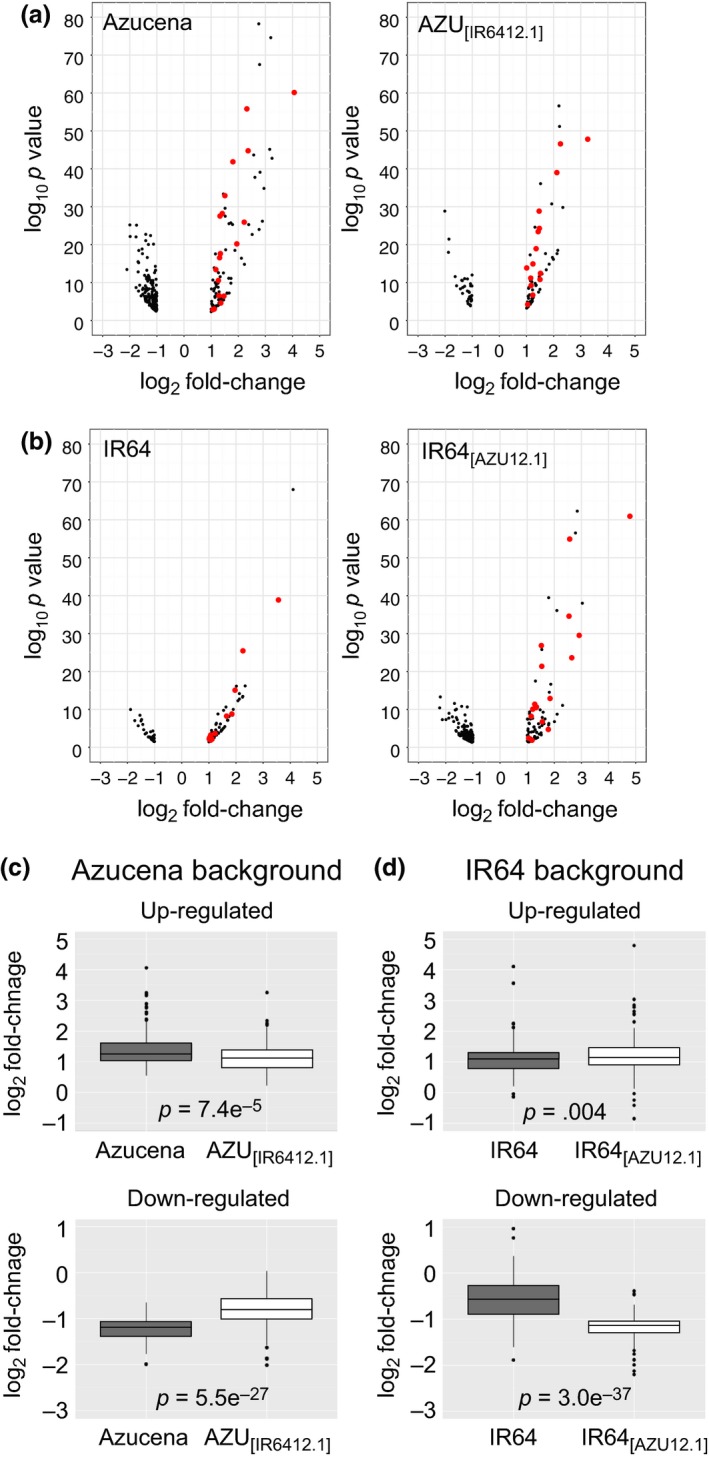
Figure 5.

Gene expression responses to Al stress differ in magnitude in Azucena (tropical japonica) and IR64 (indica) genetic backgrounds. (a) and (b): Volcano plots showing gene expression responses to Al stress in each genotype. The (−log10‐transformed) p values were plotted against log2 fold‐change for each differentially regulated gene. (a) Azucena background; (b) IR64 background. Genes described by Yamaji et al. (2009) are highlighted in red. (c) and (d): boxplots of gene expression changes (log2 fold‐change) of genes in Azucena (c) and IR64 (d) backgrounds. Genes up‐regulated in Azucena in response to Al (n = 98) are significantly more up‐regulated than those in the NIL AZU [ IR 6412.1] (n = 71) (p value = 7.4e‐05). Genes down‐regulated in Azucena (n = 148) are significantly more down‐regulated than those in the NIL AZU [ IR 6412.1] (n = 36) (p value = 5.55e‐27). Conversely, genes in IR64 (n = 81) are less up‐regulated in response to Al than those in the NIL IR64[ AZU 12.1] (n = 115) (p value = .004). Genes down‐regulated in IR64 (n = 35) are significantly less down‐regulated than those in the NIL IR64[ AZU 12.1] (p value = 3e‐37) (n = 164)
