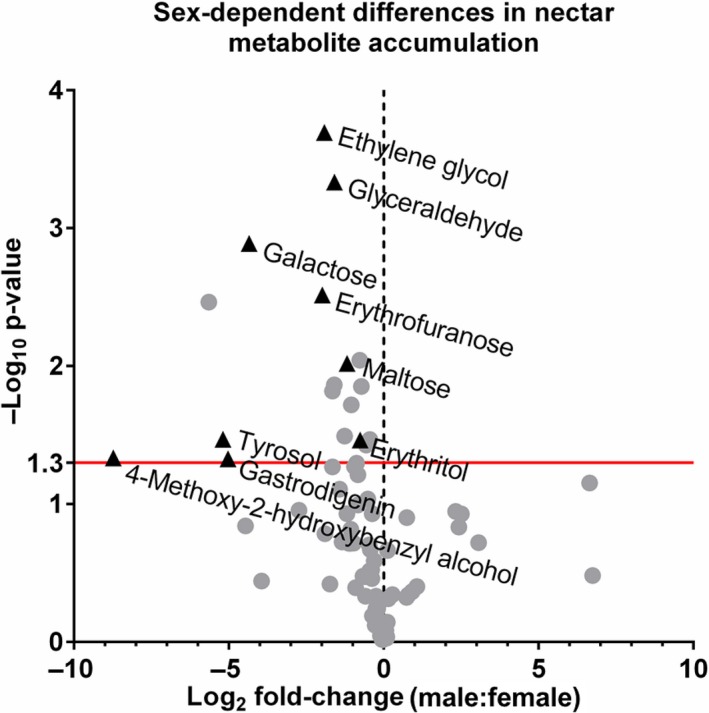
Figure 6.

Volcano plot of the Cucurbita pepo nectar metabolome with the x axis representing the log2 fold‐change of male‐to‐female metabolite concentration and the y‐axis representing the negative log10 of the adjusted p‐value. Points above the red line represent metabolites with p‐values < 0.05 between male and female metabolite
