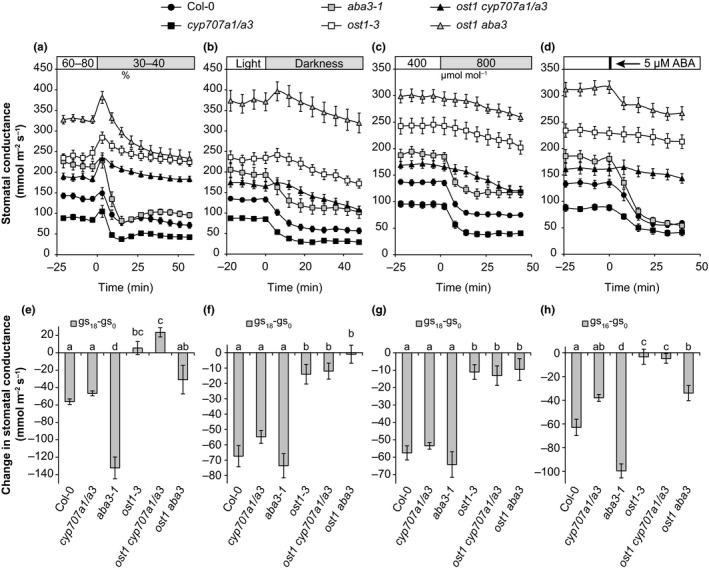
Figure 4.

(a–d) Time courses of stomatal conductances in response to reduced air humidity (a), darkness (b), elevated CO 2 (c) and ABA treatment (d). (e–h) Changes in stomatal conductance during the first 18 min (first 16 min in the ABA treatment). Letters denote statistically significant differences between lines (ANOVA with Tukey unequal N HSD post hoc test, p < 0.05; n = 8–15)
