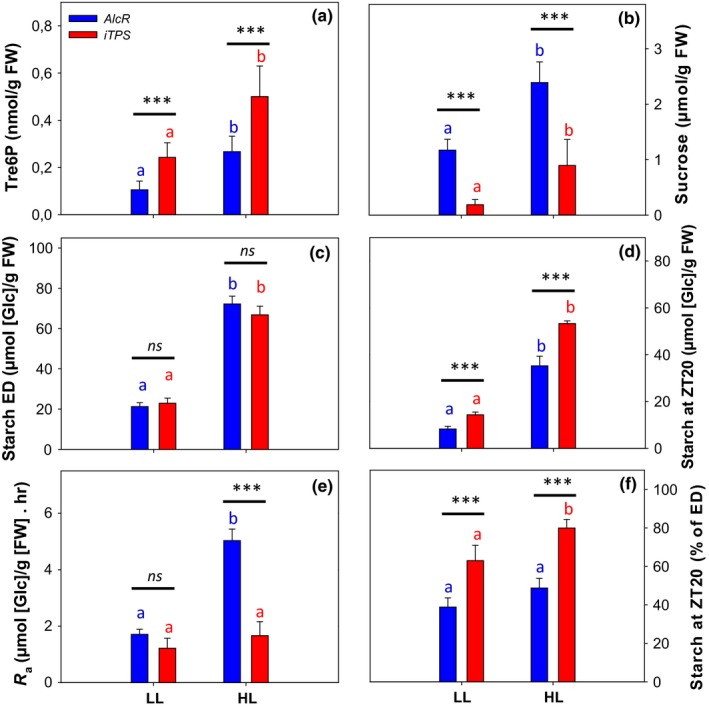
Figure 4.

Effect of induced TPS overexpression on night‐time metabolite levels after short‐term perturbations to generate high or low starch content at dusk. The empty‐vector control AlcR and iTPS plants were grown under standard conditions (12‐hr/12‐hr light/dark cycle, 21°C, 160 μmol m−2 s−1 PFD). Three weeks after germination, batches of plants were shifted for a single day either to low light (LL, 12‐hr photoperiod, 21°C, 80 μmol m−2 s−1 PFD), or to high light (HL, 12‐hr photoperiod, 21°C, 320 μmol m−2 s−1 PFD). Plants were induced 2 hr before dusk by spraying with 2% (v/v) ethanol. Samples were collected at the end of the day (ED) after the shift, and throughout the following dark period at 2‐hr intervals, up to ZT20. (a) Night‐time sucrose and (b) night‐time Tre6P levels, averaged from ZT14 to ZT20, see Figure 5 for values at each time; (c) starch content at ED; (d) absolute rate of starch mobilization (R a), estimated from the slope of the linear regression on starch content between ZT12 and ZT20 (see Figure 6); (e) starch content at ZT20; (f) starch content at ZT20 expressed as a percentage of the starch content at ED (ZT12). Values are means ± SD (n = 5). Asterisks indicate statistically significant genotype‐dependent differences in a given treatment: *p < 0.05, **p < 0.01, and ***p < 0.001. Letters indicate significant treatment‐dependent differences in a given genotype: blue letters indicate treatment differences within WTC ol‐0, and red letters indicate differences within sweet11;12 double mutant (one‐way ANOVA, Holm‐Sidak post hoc pairwise multiple comparison testing, p < 0.01). ZT, zeitgeber time (hours after dawn)
