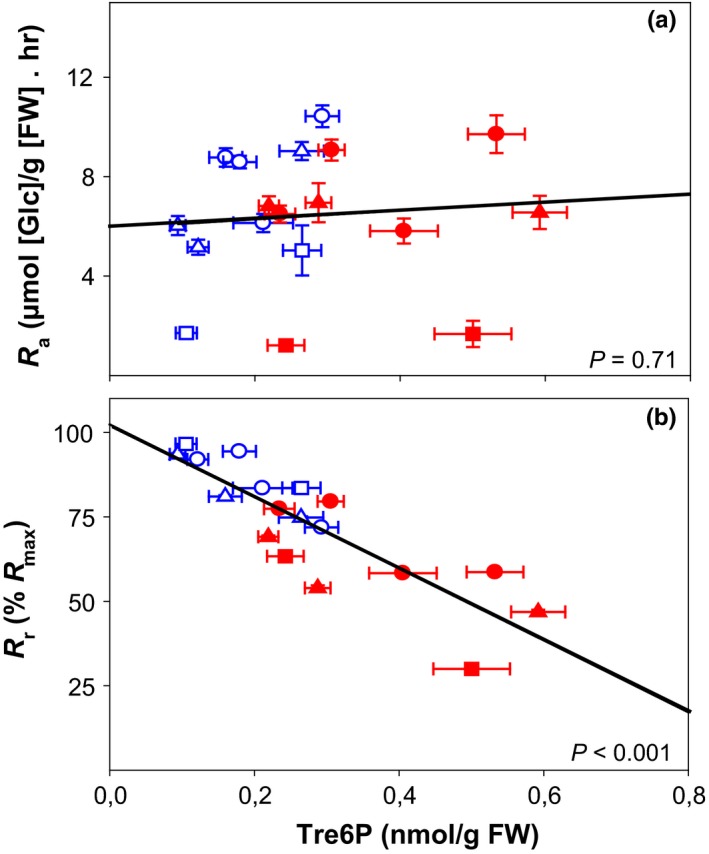
Figure 6.

Correlation of average night‐time Tre6P contents and starch mobilization in Arabidopsis rosettes. The plots show the relation between Tre6P levels and (a) the absolute starch mobilization rate (R a), and (b) the relative starch mobilization rate (R r) in wild‐type Col‐0, sweet11;12 double mutant, AlcR empty‐vector control and induced TPS‐overexpressor (iTPS) line grown under standard conditions and subjected for the preceding light period to different light intensities or to different photoperiods (for details see legends of Figures 2 and 4). Values for Tre6P are the average values between ZT15 and ZT24 for experiments with wild‐type Col‐0 and sweet11;12 mutant (see Figure 2b, Supporting Information Figure S3B) and between ZT14 and ZT20 for the experiment with AlcR and iTPS (Figure 4b). Values for R a are derived from Figure 3 and Supporting Information Figure S4 for wild‐type Col‐0 and sweet11;12, and from Figure 6 for AlcR and iTPS. R r is calculated as R a/R max, where R max is the rate of starch mobilization that would exhaust starch at EN. R r is also geometrically equivalent to the proportion of starch at ED that would remain at EN. The underlying calculations are provided in Supporting Information Table S4
