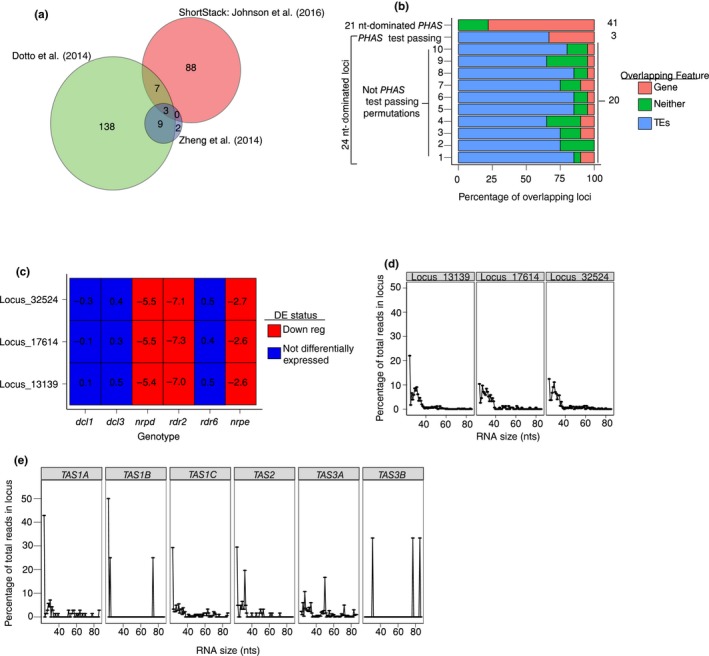
Figure 2.

Properties of three Arabidopsis thaliana 24 nt‐dominated small RNA loci that were called ‘phased’ by three different methods. (a) Venn diagram shows numbers of 24 nt‐dominated loci that were called ‘phased’ by the indicated algorithms. (b) Percentage of the three PHAS‐test passing loci overlapping either genes or transposable elements. The percentage is calculated as: (number of loci intersecting a feature/total number of loci in category)*100. The total number of loci in each category is given on the right. For 24 nt not‐PHAS loci, 10 randomly selected cohorts of 20 loci each are shown. (c) Accumulation of the three PHAS‐test passing loci in different genetic backgrounds. Numbers represent the ratio of small RNA accumulation in the indicated genotypes over that in corresponding wild‐type library as computed by DESeq2. The differential expression status was determined via DESeq2 at an FDR of 0.1. (d) Percentage of short RNAs from dcl2/dcl3/dcl4 triple mutant libraries by read length for the three PHAS‐test passing loci. (e) Same as in Panel d, except for five known A. thaliana TAS loci
