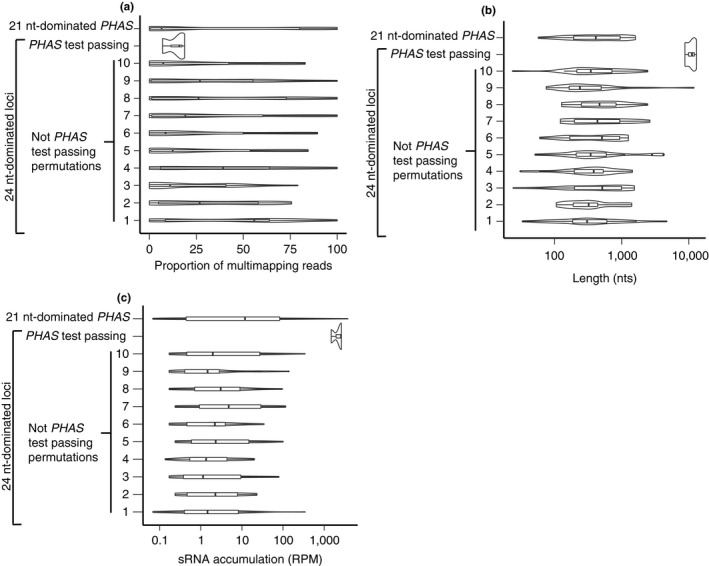
Figure 3.

The three PHAS‐test passing small RNA loci have distinct properties compared to other 24 nt‐dominated loci. (a) The proportion of multimapped reads in three different types of small RNA loci. For 24 nt‐dominated loci that were not called PHAS loci, 10 cohorts comprising 20 randomly selected loci were used as controls. The width of the density plot shows the frequency. The inset boxes show medians (horizontal lines), the 1st–3rd quartile range (boxes), other data out to 1.5 times the interquartile range (whiskers) and outliers (dots). (b) Same as panel a except showing small RNA accumulation. (c) Same as panel a except showing small RNA locus length
