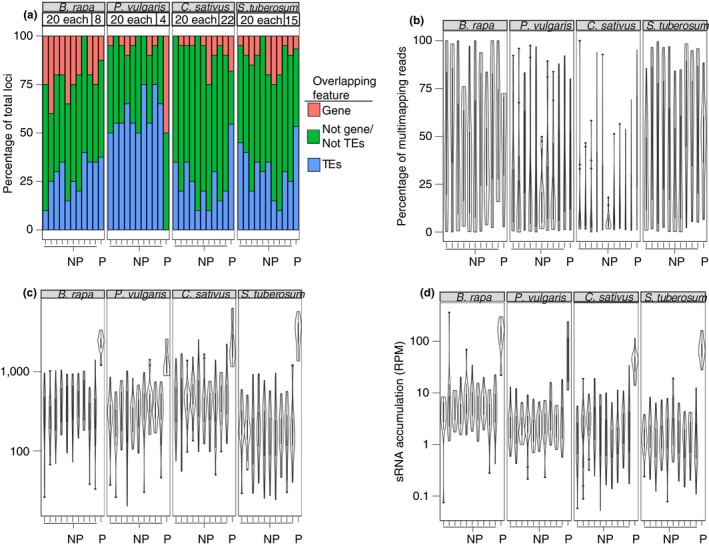
Figure 5.

Four divergent species also contain 24 nt‐dominated loci that passed the three PHAS‐detecting algorithms. (a) Percentage of 24 nt‐dominated Loci overlapping genes, transposable elements, or neither. The species name is shown in the top grey boxes. P: PHAS‐test passing locus; NP: Not PHAS‐test passing locus. For NP loci, 10 cohorts of 20 randomly selected loci each were used as negative controls. The number of loci in each category is shown above the bar graphs. (b) Same as panel a except showing the proportion of multimapping reads. (c) Same as panel a except showing length of the small RNA locus. (d) Same as panel a except showing small RNA accumulation
