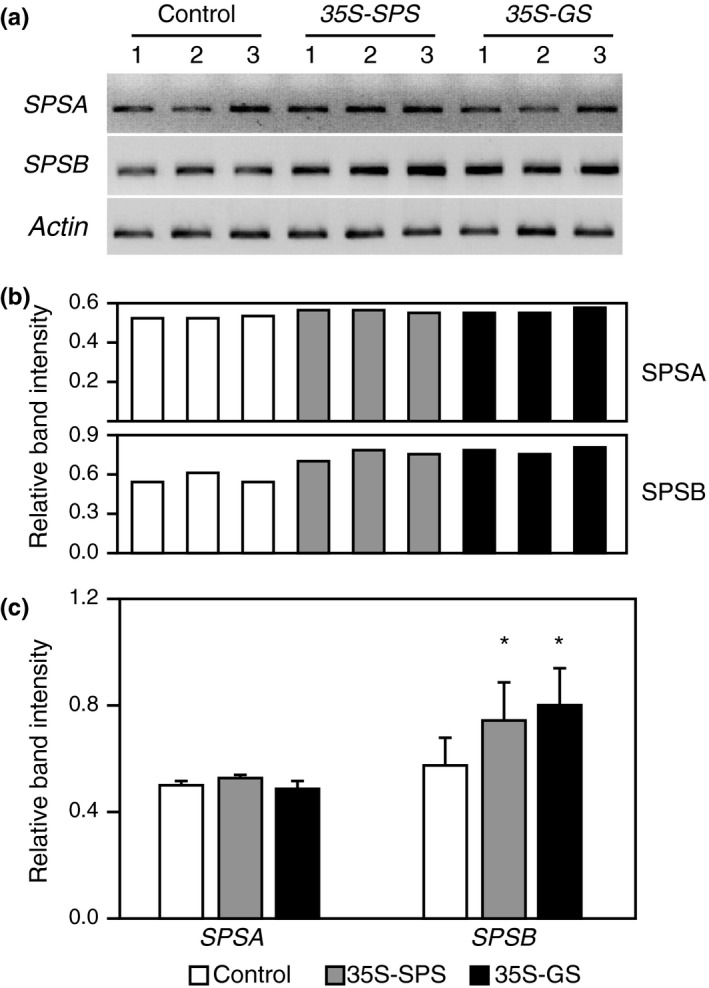
Figure 4.

Analysis of transcript accumulation for the endogenous SPS genes in the leaves of control, 35S‐SPS, and 35S‐GS transformants. (a) A quantity of 2 μg of total RNA isolated from the leaves of the same set of plants used for protein analysis was subjected to semiquantitive RT‐PCR using primer sets specific for SPSA,SPSB, and Actin (internal control for RNA concentration). Following amplification, the products were subjected to electrophoresis. Data from a representative experiment is shown here. (b) The band intensities were measured using the KODAK image software. The ratio of the band intensity obtained for SPSA and SPSB genes relative to the band intensity obtained with the Actin primer set was calculated for each transformant. The values obtained for the three independent transformants representing the 35S‐SPS and 35S‐GS classes were then compared with the average value obtained for the three control plants and plotted as bar graphs. Significant differences from the control plants were evaluated by ANOVA contrast test and shown by asterisks (*p < 0.05 or **<0.01)
