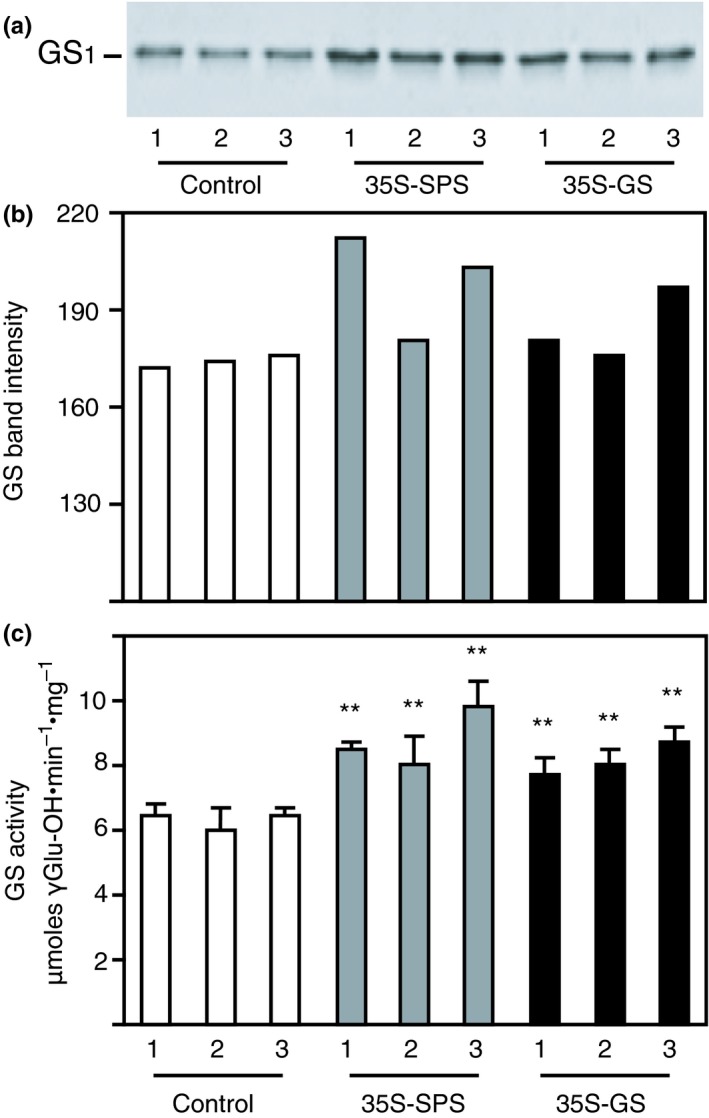
Figure 6.

Analysis of GS protein and GS enzyme activity in the nodules of control, 35S‐SPS, and 35S‐GS transformants. (a) A quantity of 1 μg of total protein extracted from the leaves of three clonally propagated plants for each independent transformant was subjected to SDS–PAGE (10% acrylamide) followed by western blot analysis using GS antibodies. A representative blot is shown here. The size of the immunoreactive band was determined based on the migration of proteins of known molecular weight. (b) The immunoreactive bands from the western blot were quantified using the KODAK image analysis software and plotted as band intensity. (c) GS transferase activity was measured in the nodule extracts used for GS western blot analysis and GS activity values were plotted as μmol γ‐glutamyl hydroxamate produced per minute per mg of protein at 30°C. Values are the means ± SD of samples from three different replicates for each independent transformant. Significant differences from the average value obtained for the control plants were evaluated by ANOVA contrast test and shown by asterisks (*p < 0.05 or **<0.01)
