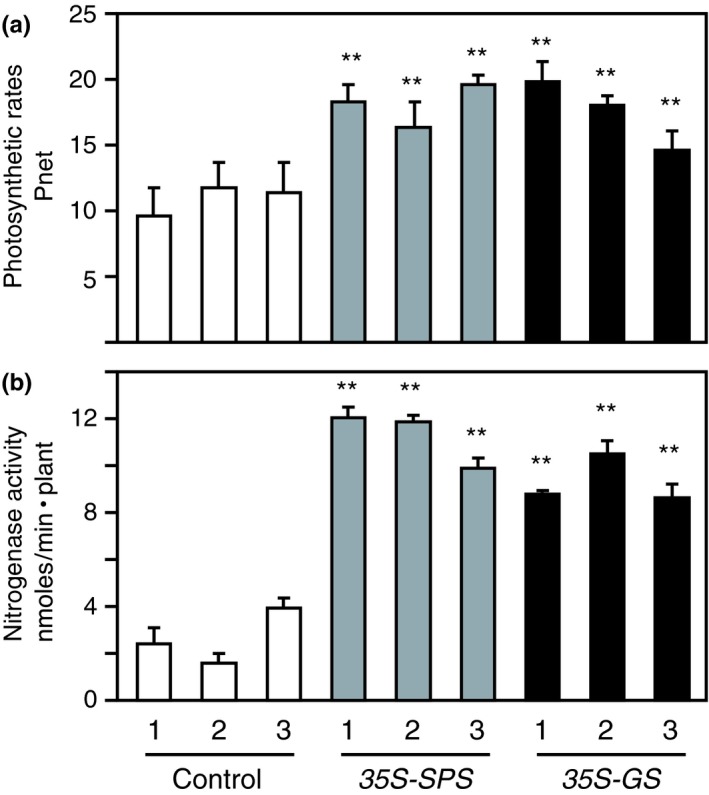
Figure 10.

Analysis of (a) photosynthetic rates in the leaves and (b) nitrogenase activity in the nodules of control, 35S‐SPS and 35S‐GS transformants. (a) Clonally propagated plants were inoculated with Sinorhizobium meliloti and 30 days post‐inoculation, the photosynthetic rates were measured in mature trifoliate leaves from three replicates for each independent transformant. Photosynthetic rates (P net), measured as mmole CO 2 m−2 s−1, were determined using a conifer chamber attached to a Li‐Cor 6400 photosynthesis system. Values for three different replicates for each independent transformants were calculated as mean value ± SD. Significant differences between each independent transformant belonging to the 35S‐SPS and 35S‐GS classes, and the average value obtained for the three control plants were evaluated by ANOVA contrast test and shown by asterisks (*p < 0.05 or **<0.01). (b) Established cuttings were inoculated with S. meliloti and allowed to grow for a period of 30 days. The plants were then uprooted, and the roots of the plants were placed individually in mason jars and nitrogenase activity was measured as nmol ethylene per plant using the acetylene reduction assay as described in Section 2. Values for three to five different replicates for each independent transformants representing each class were measured, and the mean value ± SD was calculated for each individual transformant. Significant differences between the 35S‐SPS and 35S‐GS transformants from the average value obtained for the control plants were evaluated by ANOVA contrast test and shown by asterisks (*p < 0.05 or **<0.01)
