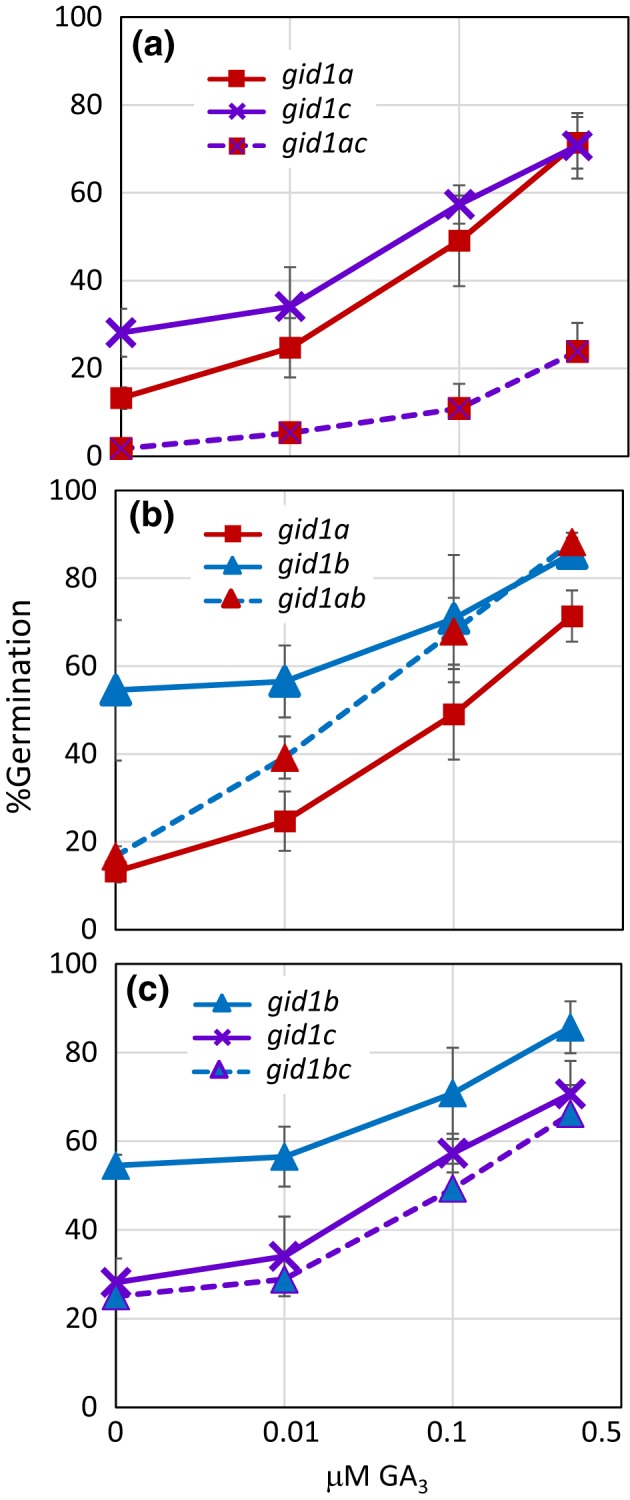
Figure 3.

Epistasis analysis of gid1 mutant GA dose–response. Compared are light germination of: (a) gid1a and gid1c to gid1ac, (b) gid1a and gid1b to gid1ab, and (c) gid1a and gid1c to gid1ac. Seeds were incubated in 10 μM PAC for 48 hr at 4°C in dark, washed, and then incubated in the light for 5 days at 22°C on MS‐agar containing 0, 0.01, 0.1 and 0.5 μM GA 3. Germination was scored daily. The x‐axis is log10 scale. Error = SD (n = 4) is shown
