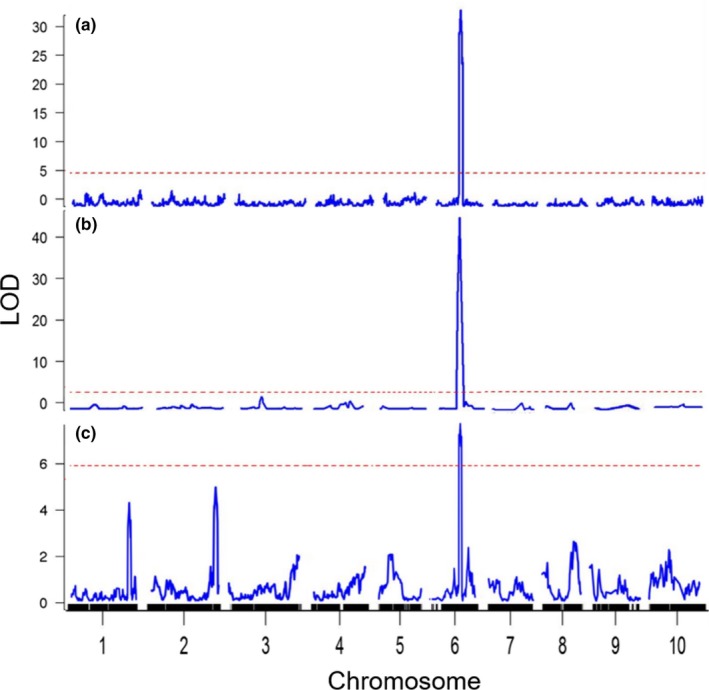
Figure 2.

QTL associated with variation in aerenchyma (AER) formation were mapped in three biparental populations: BTx623*IS3620c (a, n = 380, RIL), BTx623*R07007 (b, n = 215, F5), and BTx623*Standard Broomcorn (c, n = 133, F2). The extent of AER formation in each line was rated visually in cross sections at a midpoint of fully elongated internodes. Main effect QTL colocalized to chromosome 6 in all three populations where the BTx623 allele reduced stem AER formation. QTL analyses were performed in R/qtl using composite interval mapping. AER ratings in BTx623*IS3620c were from one biological replicate per RIL. AER ratings in BTx623*R07007 are the average of three biological replicates per individual
